


Market Fear Spikes: VIX Index Climbs 16.13% While S&P 500 Drops 2.6% in Worst Day Since October
Key Points
VIX Index surged 16.13%, signaling a sharp rise in market fear and volatility.
S&P 500 dropped 2.6%, marking its worst trading day since October 2025.
Strong U.S. jobs data fueled concerns that interest rates could stay higher for longer.
Technology and semiconductor stocks led the selloff, wiping out nearly $1.8 trillion in market value.
Market volatility returned with force as the VIX Index, Wall Street’s widely watched fear gauge, surged 16.13% while the S&P 500 tumbled 2.6% in its worst trading session since October. The sharp move reflected growing investor concerns over interest rates, economic uncertainty, and broader market risks. As traders rushed to reassess their positions, volatility spread across major sectors. What triggered this sudden wave of fear, and what could it mean for markets in the weeks ahead?
VIX Index Jumps 16.13% as Investor Anxiety Returns
What the VIX Measures and Why Traders Watch It?
The VIX Index, created by the Chicago Board Options Exchange (CBOE), measures expected volatility in the S&P 500 over the next 30 days. Investors often call it Wall Street’s “fear gauge” because it tends to rise when uncertainty increases.
When stock prices fall sharply, demand for options usually rises. That pushes the VIX higher. A rising VIX often signals that traders expect larger market swings ahead. Following the latest selloff, the VIX surged more than 16%, reflecting a sudden shift from optimism to caution.
Key Numbers Behind the Latest Fear Spike
The market shock came on June 5, 2026. The S&P 500 dropped 2.6%, marking its worst one-day decline since October 2025. At the same time, the VIX jumped 16.13%, reaching its highest level in months. The Nasdaq Composite plunged 4.2%, while the Dow Jones Industrial Average lost nearly 700 points. These moves highlighted growing concerns about interest rates and economic uncertainty.
Why the S&P 500 Suffered Its Worst Day Since October?
Strong Jobs Data Sparks Rate-Hike Concerns
A stronger-than-expected U.S. jobs report triggered much of the selling pressure. The Labor Department reported that employers added 172,000 jobs in May 2026, significantly above market expectations.
Normally, strong employment data is positive. However, investors worried that a resilient labor market could keep inflation elevated. That may force the Federal Reserve to maintain higher interest rates for longer or even consider additional tightening. Treasury yields climbed immediately after the report, adding pressure to stocks.
Tech Stocks Lead the Market Selloff
Technology shares experienced the heaviest losses. The Nasdaq Composite recorded its largest point decline on record, falling more than 1,120 points. Semiconductor companies were hit particularly hard.
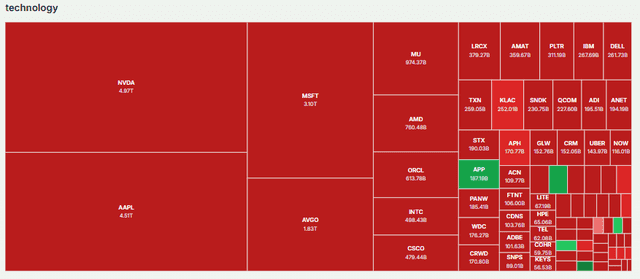
The PHLX Semiconductor Index plunged 10.3%, its worst single-day drop since March 2020. Investors rushed to lock in profits after months of gains driven by artificial intelligence optimism. Major chipmakers and AI-related companies led the decline.
Geopolitical Risks Add to Market Stress
Geopolitical tensions also weighed on sentiment. Rising conflict in the Middle East increased uncertainty around energy prices and global economic stability. Investors shifted money into defensive sectors while reducing exposure to higher-risk growth stocks.
Biggest Losers and Market Damage in One Trading Session
$1.8 Trillion in Market Value Erased
According to MarketWatch, approximately $1.8 trillion in market value disappeared from U.S. equities during the selloff. The S&P 500 fell to 7,383.74, while the Nasdaq dropped 4.2%.
This was the first weekly loss for the S&P 500 after nine consecutive winning weeks. Investors suddenly moved from chasing gains to protecting capital.
Semiconductor Sector Hit Hardest
Chip stocks suffered the most severe damage. The semiconductor industry lost roughly $1.2 trillion in market value in a single session. Concerns over valuations, profit-taking, and slowing momentum combined to accelerate selling.
Defensive Stocks Stand Out
Not every sector declined. Consumer staples and healthcare stocks held up relatively well as investors searched for safer investments. This classic defensive rotation often appears during periods of elevated volatility.
What History Says When the VIX Surges This Fast?
Past Volatility Events and Market Reactions
History shows that sharp VIX spikes often occur during periods of economic uncertainty, geopolitical shocks, or major policy changes. While these episodes can trigger steep corrections, they do not always signal the start of a prolonged bear market.
Many previous volatility surges were followed by stabilization once investors gained clarity on economic conditions.
Signals Investors Should Monitor Next
Investors should closely watch:
- Upcoming U.S. inflation reports
- Federal Reserve policy statements
- Treasury yield movements
- Corporate earnings guidance
- Market breadth indicators
Tools such as the Meyka AI stock analysis tool can help investors track changing market sentiment and identify emerging risks during volatile periods.
Conclusion
The recent surge in the VIX Index and the S&P 500’s 2.6% decline highlight how quickly market sentiment can change. Strong economic data, rising Treasury yields, technology-sector weakness, and geopolitical tensions combined to trigger the sharp selloff. While volatility has returned, history suggests investors should focus on economic fundamentals rather than short-term fear.
The next inflation reports and Federal Reserve decisions will likely determine whether this becomes a deeper correction or a temporary pause in the broader market rally.
Disclaimer:
The content shared by Meyka AI PTY LTD is solely for research and informational purposes. Meyka is not a financial advisory service, and the information provided should not be considered investment or trading advice.
What brings you to Meyka?
Pick what interests you most and we will get you started.
I'm here to read news
Find more articles like this one
I'm here to research stocks
Ask Meyka Analyst about any stock
I'm here to track my Portfolio
Get daily updates and alerts (coming March 2026)