Key Points
Ethereum is recovering in April 2026 after rebounding from the $1,840 low
ETH is trading in the $2,200-$2,400 range with key resistance near $2,400.
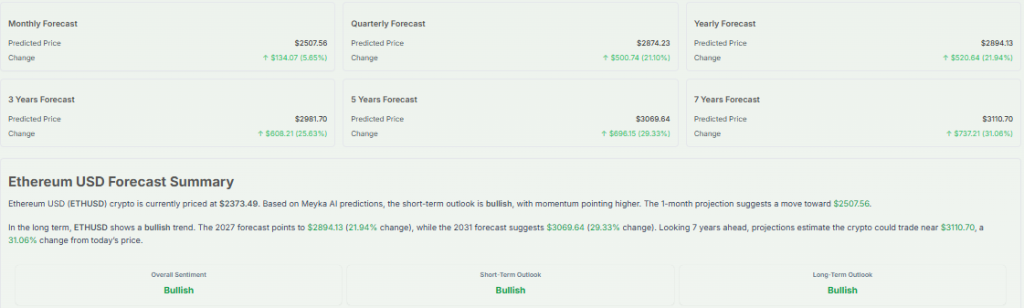
Analysts expect a potential upside move toward the $2,874 level if the breakout confirms
Market trend remains cautiously bullish, but confirmation above resistance is still needed
Ethereum (ETH), the second-largest cryptocurrency by market capitalization, is showing early signs of recovery in April 2026. After strong volatility in the first quarter, the price has stabilized near the $2,200–$2,400 range. Traders are now watching for a possible breakout. Analysts suggest that ETH could move toward the $2,874 level if bullish momentum continues.
The market is reacting to improving sentiment, steady on-chain activity, and renewed investor interest after the February 2026 low near $1,840. However, resistance remains strong in the short term. Every move above $2,400 is being closely tracked. This setup is creating strong curiosity among investors about what comes next. Volatility remains high as traders wait for confirmation.
Current Ethereum (ETH) Market Trend and Price Action
Ethereum is trading in a recovery phase in April 2026 after a highly volatile start to the year. Price data from major trackers like CoinMarketCap and CoinGecko shows ETH moving in the $2,200-2,400 range after rebounding from the February 2026 low near $1,840. Market sentiment has shifted from fear to cautious optimism as buyers slowly regain control.
The recent structure shows higher lows forming on the daily chart. This is often a sign of early trend reversal. However, strong resistance remains near $2,400 and $2,600. Traders are closely watching whether ETH can sustain momentum above these zones.
Why is Ethereum price targeting $2,874 in 2026?
The $2,874 level is being discussed because it aligns with a key technical projection zone based on historical resistance and Fibonacci retracement levels from the previous major swing high near $3,500.
Ethereum is also supported by improving on-chain activity and stable network usage. Transaction volume on Layer-2 networks continues to grow, which reduces congestion on the main chain and supports long-term scalability.
Key drivers behind the upside outlook:
- Recovery from oversold conditions in early 2026
- Gradual return of institutional inflows
- Increased staking participation, reducing circulating supply
- Strengthening support above $2,200
If ETH breaks and holds above $2,400, momentum traders expect a push toward $2,600 first, followed by a possible extension toward $2,874.
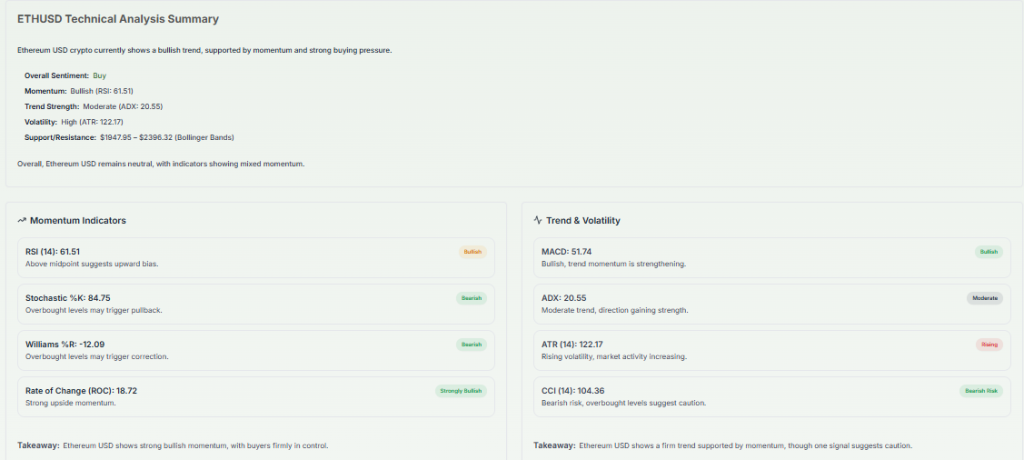
What do technical indicators say about Ethereum right now?
Ethereum’s technical setup is currently neutral-to-bullish. The RSI (Relative Strength Index) is hovering around the midpoint zone, which signals a balance between buyers and sellers. The moving averages are starting to flatten, indicating a possible trend shift.
Key technical levels:
- Support: $2,200 and $2,050
- Resistance: $2,400 and $2,600
- Breakout trigger: Daily close above $2,400
Volume remains a key confirmation factor. Without strong trading volume, ETH may continue sideways consolidation instead of a breakout.
Many analysts also highlight that Ethereum is forming a compression pattern. This usually leads to a sharp move once resistance breaks.
What does Meyka AI analysis tool indicate about Ethereum?
The AI stock analysis tool on Meyka.com generally evaluates Ethereum based on momentum, sentiment, and volatility indicators. Current AI-driven readings (based on market behavior patterns) suggest a cautious bullish outlook.
In simple terms, Meyka-style analysis typically highlights:
- Improving trend strength after recent correction
- Neutral sentiment shifting toward positive
- Resistance-heavy zone near mid-$2,000s
It also emphasizes that confirmation is needed above key resistance levels before expecting a strong breakout trend. This aligns with the broader technical market structure seen across crypto analytics platforms.
Meyka AI tools are often used to combine technical signals with sentiment scoring, helping traders identify early breakout setups.
What are other analysts saying about the ETH price forecast?
Several independent crypto analysts and platforms, like TradingView contributors and on-chain research reports, suggest a similar outlook. Most agree that Ethereum is in a mid-cycle recovery phase.
Key consensus points:
- Short-term consolidation before breakout attempt
- Strong accumulation zone between $2,000-2,300
- Long-term bullish structure remains intact above $1,900
Some analysts also point out that Ethereum tends to outperform after Bitcoin stabilizes, especially during liquidity recovery phases in crypto markets.
However, bearish analysts warn that failure to break $2,400 could delay the move and send ETH back into a broader range.
Is Ethereum still a strong long-term investment in 2026?
Ethereum continues to dominate smart contract platforms. Its ecosystem supports DeFi, NFTs, and Layer-2 scaling solutions. Despite competition, it remains the most widely adopted blockchain for decentralized applications.
Long-term strength factors include:
- Continued staking rewards model
- Growing institutional adoption
- Strong developer activity
- Expanding Layer-2 ecosystem
These fundamentals support the long-term bullish structure, even if short-term volatility remains high.
Key risks investors should watch for in Ethereum
Ethereum still faces important risks that can impact price movement:
- Regulatory uncertainty in global crypto markets
- Sudden changes in liquidity conditions
- Network congestion during high demand
- Macro-economic pressure from interest rate changes
A breakdown below $2,200 could weaken the bullish structure and delay the $2,874 target.
Final Words
Ethereum is showing early recovery signals in April 2026 after rebounding from its February low near $1,840. Price action is now stabilizing in the $2,200-2,400 range, with market attention focused on a possible breakout. If ETH holds momentum above key resistance, a move toward $2,874 becomes a realistic short-term target.
However, failure to break $2,400 could keep prices range-bound. Overall, the trend is improving, but confirmation is still needed before stronger upside continuation.
Disclaimer:
The content shared by Meyka AI PTY LTD is solely for research and informational purposes. Meyka is not a financial advisory service, and the information provided should not be considered investment or trading advice.
What brings you to Meyka?
Pick what interests you most and we will get you started.
I'm here to read news
Find more articles like this one
I'm here to research stocks
Ask Meyka Analyst about any stock
I'm here to track my Portfolio
Get daily updates and alerts (coming March 2026)