




Key Points
Technical Indicators help investors analyze stock trends, momentum, volume, and volatility using structured market data instead of emotional decisions.
Popular indicators like RSI, MACD, OBV, Stochastic Oscillator, Moving Averages, and Bollinger Bands help identify buying signals, trend reversals, and market strength.
RSI above 70 signals overbought conditions, while MACD crossovers and rising OBV help confirm bullish momentum and institutional buying activity.
Investors are advised to combine multiple indicators with risk management and company fundamentals, as no single indicator guarantees accurate market predictions.
Technical Indicators are important tools that help investors study stock market trends, momentum, trading volume, and price movement. Instead of relying only on emotions or market news, investors use indicators to make more structured and informed decisions. These tools convert price and volume data into signals that can help identify buying opportunities, trend reversals, and possible risks.
Stock research has changed over the years. Today, investors combine company fundamentals with chart analysis to build stronger strategies. This approach improves market understanding and helps traders react faster during volatile conditions. In our detailed guide, you will learn how major indicators work, why they matter, and how investors use them in real market situations.
Why Technical Indicators Matter In Modern Stock Research
Technical Indicators help investors analyze market behavior with more clarity and confidence. Markets move because of investor psychology, economic events, earnings reports, and supply-demand activity. Indicators organize that information into readable signals that support smarter trading and investing decisions.
Without indicators, many investors rely only on guesswork. However, indicators provide measurable data that can reveal whether buyers or sellers control the market. They also help investors avoid emotional reactions during sharp market swings.
Before using indicators, investors should understand the benefits they provide. Each tool serves a different purpose and can improve research quality when used correctly.
Some major advantages include:
- Trend Direction Analysis: Helps investors identify whether stocks are moving upward, downward, or sideways over a certain period.
- Momentum Strength Reading: Measures how strongly buyers or sellers are pushing stock prices in a particular direction.
- Entry And Exit Planning: Supports better decision-making when choosing buying points, profit targets, and stop-loss levels.
- Market Sentiment Understanding: Shows whether investors are becoming optimistic, fearful, aggressive, or defensive during market movements.
- Volume Confirmation Signals: Confirms whether strong trading activity supports a breakout, reversal, or trend continuation pattern.
Investors also use indicators because price patterns often repeat over time. Human emotions remain consistent in financial markets, which means chart behavior frequently follows recognizable structures.
Still, no system is perfect. Technical Indicators should always support broader stock research instead of replacing company analysis entirely.
Understanding The Main Types Of Technical Indicators
Before learning specific tools, investors should understand the major categories of Technical Indicators. Most indicators are built using stock prices, moving averages, or trading volume. Different indicators solve different market questions.
Certain indicators help identify market trends, while others track momentum or price volatility. Learning these categories makes stock research much easier.
Trend Indicators
Trend indicators help investors identify overall market direction. They show whether buyers or sellers control price movement over a longer period.
Popular examples include:
- Moving Averages
- MACD
- Average Directional Index
Trend indicators work best during strong market movements. They become less effective when markets move sideways without a clear direction.
Momentum Indicators
Momentum indicators measure the speed and strength of price movement. They help investors understand whether buying pressure is increasing or weakening.
Common momentum indicators include:
- RSI
- Stochastic Oscillator
- Commodity Channel Index
Momentum tools often help investors identify overbought or oversold conditions before trend reversals happen.
Volume Indicators
Volume indicators study trading activity behind price movement. High trading volume often confirms strong investor interest.
Popular volume indicators include:
- OBV
- Accumulation Distribution Line
- Chaikin Money Flow
Strong volume can confirm breakouts, while weak volume may signal unreliable price movement.
Volatility Indicators
Volatility indicators measure market fluctuations and price expansion. They help investors understand market risk and possible breakout conditions.
Well-known volatility indicators include:
- Bollinger Bands
- Average True Range
These tools become especially useful during uncertain or highly active markets.
RSI Indicator Explained With Practical Uses
The Relative Strength Index, commonly known as RSI, is one of the most widely used Technical Indicators for stock research and momentum analysis.
RSI = 100 – \frac{100}{1 + RS}
- RSI tracks how quickly and strongly stock prices move over recent periods.
- RSI helps traders understand the momentum behind recent market price movements.
- RSI evaluates the pace and intensity of recent changes in stock prices.
- RSI indicates whether recent price movements are gaining or losing momentum.
- RSI analyzes recent price action to measure market strength and movement speed.
It ranges between 0 and 100, helping investors identify possible overbought or oversold conditions.
Most investors use the standard 14-day RSI setting because it balances short-term and medium-term analysis effectively.
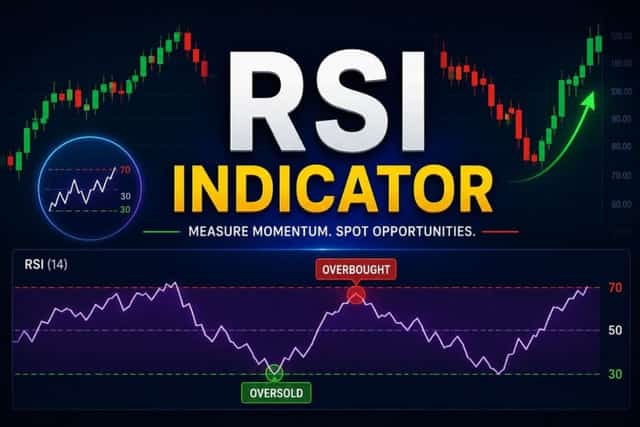
General RSI readings include:
- Above 70 Reading: Suggests the stock may be overbought after strong upward momentum and could face temporary selling pressure.
- Below 30 Reading: Indicates the stock may be oversold after heavy selling and could experience a short-term bounce.
- Around 50 Level: Shows balanced momentum where neither buyers nor sellers strongly control the market direction.
RSI becomes even more valuable when investors compare it with stock price behavior. For example, if stock prices rise while RSI weakens, momentum may be slowing. This pattern is called bearish divergence.
Investors commonly use RSI for:
- Momentum Confirmation Signals: Helps confirm whether upward or downward price movement still has strong buying or selling support.
- Trend Reversal Detection: Identifies situations where exhausted trends may reverse after extended price movement in one direction.
- Swing Trading Opportunities: Supports short-term traders searching for pullbacks, rebounds, and temporary momentum shifts in active stocks.
- Risk Management Decisions: Helps investors avoid buying stocks after excessive rallies or panic selling during temporary weakness.
Although RSI is useful, investors should avoid depending on it alone. Strong bullish trends can remain overbought for extended periods before reversing.
How MACD Helps Investors Understand Market Trends
MACD stands for Moving Average Convergence Divergence. It remains one of the most trusted Technical Indicators for studying trends and momentum together.
MACD = EMA_{12} – EMA_{26}
MACD compares short-term and long-term moving averages to measure trend strength. It contains three important parts:
- MACD Line
- Signal Line
- Histogram
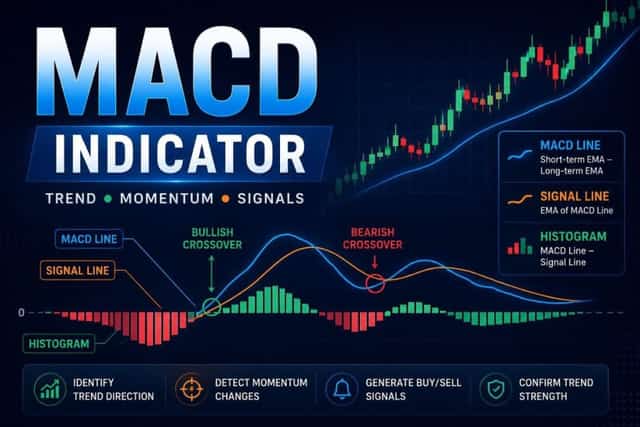
When the MACD line crosses above the signal line, many investors view it as a bullish signal. When the MACD line crosses below the signal line, it may suggest bearish momentum.
MACD offers several advantages for stock research:
- Trend Strength Measurement: Shows whether bullish or bearish momentum is strengthening or weakening during market movement.
- Bullish and Bearish Crossovers: Helps investors identify possible buying and selling opportunities based on moving average signals.
- Momentum Shift Detection: Reveals changes in market direction before major trend reversals become fully visible on price charts.
- Multi-Timeframe Flexibility: Works effectively on daily, weekly, and intraday charts across stocks, ETFs, and cryptocurrencies.
The MACD histogram is especially useful because it measures the distance between the MACD line and the signal line. Expanding bars often suggest stronger momentum.
However, MACD reacts slightly slower than faster indicators like RSI because it depends on moving averages. Investors should combine MACD with volume confirmation and price action analysis for better accuracy.
Why OBV Is Important For Volume Analysis
On Balance Volume, also called OBV, is one of the most valuable Technical Indicators for studying trading volume and institutional activity.
OBV = OBV_{previous} \pm Volume
OBV focuses on the relationship between trading volume and price movement. The idea is simple. Rising volume during price increases may indicate strong buying pressure. Rising volume during price declines may indicate aggressive selling pressure.
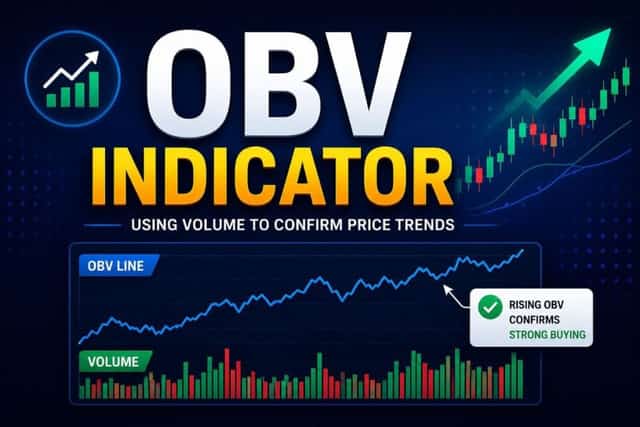
Volume often reveals hidden market activity before major price movement happens. Institutional investors usually accumulate positions gradually, and OBV can help detect that process early.
OBV helps investors through several important signals:
- Breakout Confirmation Support: Confirms whether rising volume supports a strong and reliable stock breakout above resistance levels.
- Institutional Buying Detection: Helps identify accumulation patterns where large investors quietly build positions before major rallies begin.
- Trend Continuation Validation: Shows whether the ongoing bullish or bearish price movement still has healthy trading participation behind it.
- Divergence Warning Signals: Reveals situations where volume behavior disagrees with price action and warns about possible reversals.
For example, if stock prices remain flat while OBV rises steadily, buyers may already be accumulating shares quietly before a breakout.
Volume analysis matters because price alone cannot always explain market behavior completely.
Using the Stochastic Oscillator For Better Trade Timing
The Stochastic Oscillator is another widely used tool among modern Technical Indicators. It compares the latest closing price with a stock’s recent trading range.
%K = \frac{Current\ Close – Lowest\ Low}{Highest\ High – Lowest\ Low} \times 100
This indicator ranges between 0 and 100. Readings above 80 may suggest overbought conditions, while readings below 20 may indicate oversold conditions.
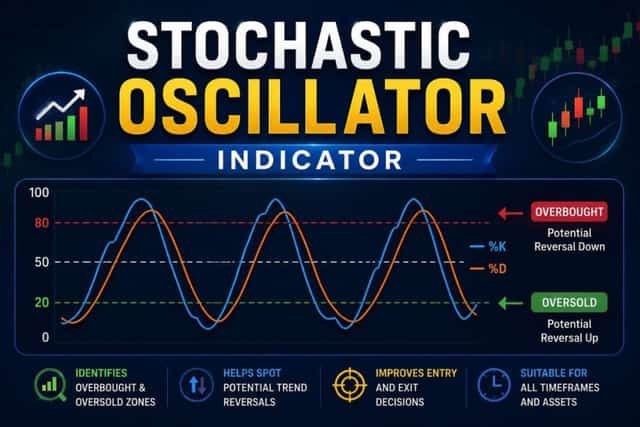
Unlike slower indicators, the Stochastic Oscillator reacts quickly to market movement. Many swing traders use it to improve entry and exit timing.
The indicator supports stock research by helping investors:
- Short-Term Entry Timing: Helps identify pullback opportunities during strong bullish trends and active trading environments.
- Momentum Reversal Signals: Detects weakening buying or selling pressure before prices fully reverse direction on stock charts.
- Swing Trading Strategy Support: Assists active traders searching for quick moves between support and resistance price zones.
- Trend Exhaustion Recognition: Reveals when aggressive momentum may be fading after extended upward or downward market movement.
Many traders combine RSI and Stochastic for stronger confirmation. When both indicators show oversold conditions, confidence in a possible rebound increases.
However, fast-moving indicators can generate false signals during extremely volatile markets. Investors should confirm signals with broader trend analysis.
Moving Averages And Bollinger Bands Simplified
Moving averages remain among the most trusted Technical Indicators because they smooth price fluctuations and simplify market trends.
The two main types include:
- Simple Moving Average
- Exponential Moving Average
SMA = \frac{P_1 + P_2 + … + P_n}{n}
Moving averages help investors identify long-term market direction more clearly. The 50-day and 200-day moving averages are especially popular among institutional investors.
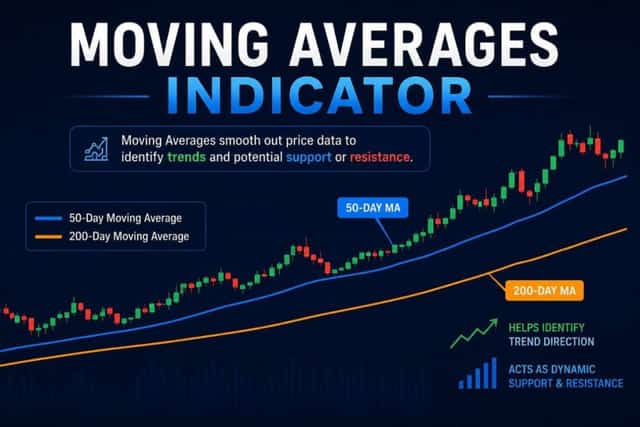
Key moving average benefits include:
- Trend Direction Clarity: Smooths short-term price noise and reveals broader market direction more clearly for investors.
- Support And Resistance Zones: Creates dynamic price levels where buyers or sellers often react strongly during market movement.
- Golden Cross Signals: Identifies bullish trends when shorter moving averages rise above longer-term moving averages.
- Death Cross Warnings: Signals possible bearish trends when shorter averages fall below long-term moving average levels.
Bollinger Bands expand on moving averages by adding volatility measurements.
Upper\ Band = SMA + 2\sigma
Bollinger Bands help investors measure volatility and possible breakout conditions.
Their advantages include:
- Volatility Expansion Signals: Shows when market activity increases sharply and larger price swings become more likely.
- Price Compression Detection: Identifies calm trading periods that may lead to powerful breakout movement afterward.
- Overextended Price Recognition: Helps investors detect stocks trading too far above or below normal ranges temporarily.
- Breakout Opportunity Analysis: Supports traders searching for momentum expansion after tight trading conditions and low volatility phases.
Best Ways To Combine Technical Indicators Effectively
Many investors fail because they overload charts with too many Technical Indicators at once. A cleaner and balanced setup usually works better.
Instead of using multiple indicators that provide similar signals, investors should combine tools from different categories.
A balanced setup may include:
- MACD for trend direction.
- RSI for momentum analysis.
- OBV for volume confirmation.
- Bollinger Bands for volatility.
This combination creates a fuller market picture without unnecessary complexity.
Investors should also follow these important principles:
Avoid Indicator Duplication
Using too many momentum indicators together often creates repetitive information and unnecessary confusion during stock analysis.
Study Market Conditions Carefully
Indicators perform differently in bullish, bearish, and sideways markets, so broader trend context always remains important.
Use Proper Risk Management
No indicator guarantees profits, which is why stop-loss planning and position sizing remain essential for long-term success.
Practice Before Investing Real Money
Testing strategies on historical charts helps investors improve confidence, discipline, and understanding before entering live trades.
Common Mistakes Investors Make With Technical Indicators
Many beginners misuse Technical Indicators because they expect perfect accuracy from every signal. Markets remain unpredictable, even with advanced tools.
One common mistake is relying on a single indicator without confirmation from price action or volume. Another mistake is ignoring higher timeframes while focusing only on short-term charts.
Investors should also avoid:
- Overtrading Weak Signals: Taking too many trades based on small indicator changes without strong market confirmation.
- Ignoring Market News Events: Forgetting that earnings reports and economic data can quickly override technical setups.
- Using Complex Chart Layouts: Adding excessive indicators that create confusion instead of improving decision-making quality.
- Emotional Trading Reactions: Abandoning proven strategies after short-term losses caused by normal market fluctuations.
Patience, discipline, and continuous learning matter far more than searching for perfect prediction systems.
Final Thoughts
Technical Indicators help investors understand stock trends, momentum, volatility, and trading activity with greater confidence and structure. RSI, MACD, OBV, Stochastic Oscillator, moving averages, and Bollinger Bands each provide valuable insights that improve market analysis and trading decisions.
The best investors utilize technical indicators in conjunction with strong risk management, patience, and comprehensive stock research. Instead of chasing quick profits, focus on developing a disciplined process that supports consistent learning and informed, long-term investment decisions.
Disclaimer
The content shared by Meyka AI PTY LTD is solely for research and informational purposes. Meyka is not a financial advisory service, and the information provided should not be considered investment or trading advice.
What brings you to Meyka?
Pick what interests you most and we will get you started.
I'm here to read news
Find more articles like this one
I'm here to research stocks
Ask Meyka Analyst about any stock
I'm here to track my Portfolio
Get daily updates and alerts (coming March 2026)