Key Points
Solana (SOL) climbed above the key $70 level, signaling renewed bullish momentum.
Crypto ETF inflows reached $1.45 billion, boosting institutional confidence in digital assets.
Traders are closely watching the crucial $75 resistance zone for the next breakout signal.
Growing network activity and strong ecosystem expansion continue to support Solana's outlook.
Solana is back in the spotlight after climbing above the $70 mark, a level many traders have been watching closely. The move comes as crypto investment products continue to attract strong institutional demand, with ETF inflows reaching $1.45 billion in recent weeks.
As of June 2026, growing market confidence and improving sentiment across digital assets are helping fuel SOL’s momentum. With the next major resistance near $75, investors are now asking whether this rally still has room to run.
Solana Price Surges Above $70 Amid Renewed Market Momentum
SOL Reclaims a Key Psychological Level
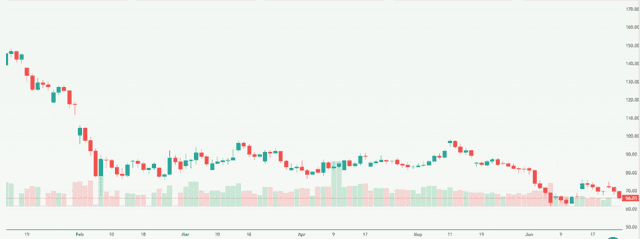
Solana (SOL) has moved back above the important $70 level, attracting fresh attention from traders and investors. The token recently recovered from June lows near $61.50 and pushed past a resistance area that had limited gains for several weeks.
According to recent market data, SOL climbed above $70 after strong buying activity returned across the crypto market. Daily trading volume also increased significantly, showing renewed participation from market participants.
Broader Crypto Market Provides Tailwinds
The wider crypto market has helped support Solana’s recovery. Bitcoin and other leading digital assets have stabilized after recent volatility. This has improved risk appetite among investors.
As sentiment improved, capital started flowing back into major altcoins, including Solana. Market analysts note that SOL’s rebound is closely linked to stronger confidence across the digital asset sector.
ETF Inflows Reach $1.45 Billion and Boost Institutional Confidence
How ETF Demand Is Supporting Crypto Assets?
One of the biggest drivers behind Solana’s recent rally is the growth of institutional investment. Recent reports show that Solana-related ETF products have attracted approximately $1.45 billion in inflows. This highlights growing demand from professional investors seeking exposure to the asset class.
ETF inflows are often viewed as a sign of long-term confidence because they bring more stable capital into the market. Strong inflows can also reduce selling pressure and improve liquidity.
Why Solana Is Benefiting From Institutional Interest?
Solana continues to strengthen its position as one of the leading Layer-1 blockchain networks. The ecosystem supports decentralized finance, gaming, tokenized assets, and payment applications.
Institutional interest has also increased following new ETF-related filings and product developments in the United States. Recent reports indicate that Solana-focused ETFs recorded positive weekly inflows while network activity remained strong.
Solana Forecast, Technical Analysis Summary, and What Meyka Says
Meyka’s latest Solana analysis highlights improving sentiment, growing trading activity, and positive technical signals. Earlier reports from Meyka identified strong buying volume and stabilization after periods of weakness. The platform noted that support zones and rising market participation could help sustain bullish momentum if buyers maintain control.
An AI stock analysis tool can help investors monitor technical indicators, trading volume, and sentiment changes, but market conditions can change quickly in crypto assets.
Technical Analysis: Can SOL Break Through the $75 Resistance?
Key Resistance Levels Traders are Watching
The next major hurdle for Solana sits near $75. Several analysts identify this zone as a key resistance area because it aligns with important moving averages and previous selling pressure. If buyers push above $75, analysts see potential upside targets near $85 and $97.
Critical Support Zones Below Current Prices
Support remains near $70 and $65. Holding above these levels would keep the current recovery intact. A breakdown below support could trigger another test of the lower levels seen earlier in June.
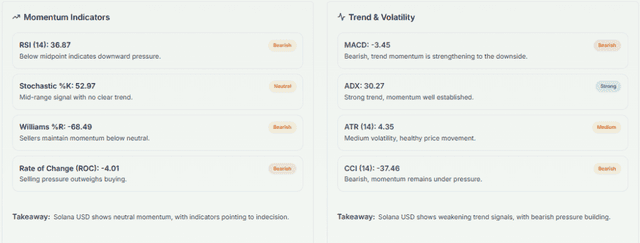
What Market Indicators Suggest?
Technical indicators present a mixed but improving picture. Rising volume, stronger momentum, and ETF inflows support the bullish case. However, some short-term indicators suggest traders should remain cautious until SOL confirms a clear breakout above $75.
What Could Drive Solana’s Next Move Higher?
Network Growth and Ecosystem Expansion
Solana’s network continues to grow. Reports show daily transactions have reached around 120 million, while activity in tokenized real-world assets continues to expand. The blockchain also recently surpassed 285,000 RWA holders, strengthening its position in the sector.
Macro and Regulatory Catalysts
Additional ETF approvals, improving regulatory clarity, and stronger institutional adoption could provide further upside catalysts. Market participants are also watching broader economic conditions and Bitcoin’s performance, which often influence altcoin sentiment.
Conclusion
Solana’s move above $70 marks an important recovery for the cryptocurrency. Strong ETF inflows, rising institutional participation, and growing network activity are supporting the bullish narrative. The $75 resistance level remains the key area to watch.
A successful breakout could open the door to higher targets, while failure to clear resistance may lead to short-term consolidation. For now, momentum favors the bulls, but traders should continue monitoring volume, ETF flows, and broader market conditions.
Disclaimer:
The content shared by Meyka AI PTY LTD is solely for research and informational purposes. Meyka is not a financial advisory service, and the information provided should not be considered investment or trading advice.
What brings you to Meyka?
Pick what interests you most and we will get you started.
I'm here to read news
Find more articles like this one
I'm here to research stocks
Ask Meyka Analyst about any stock
I'm here to track my Portfolio
Get daily updates and alerts (coming March 2026)