SOL Trades at $68.47 After Recovering From $60 Lows, but $77-$78 Barrier Keeps Buy Signal on Hold
Key Points
SOL rebounded more than 13% after finding strong support near $60.
The critical $77-$78 resistance zone continues to block a confirmed buy signal.
A breakout above $78 could open the door to $85-$90 price targets.
Traders are closely watching volume and momentum indicators for confirmation.
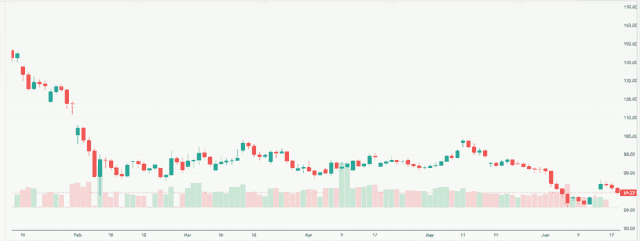
Solana (SOL) is showing signs of strength after rebounding from recent lows near $60 and climbing back to around $68.47. The recovery has sparked renewed interest among traders, especially as the broader crypto market attempts to regain momentum in June 2026.
However, a major challenge still stands ahead. The key resistance zone between $77 and $78 continues to block a stronger bullish move. Can SOL break through this barrier and confirm a new uptrend, or is another pullback on the horizon?
SOL Rebounds From Key Support After Testing Multi-Week Lows
Recovery From the $60-65 Demand Zone
Solana has staged a notable recovery after falling to the $60 area in early June 2026. Buyers stepped in aggressively near this support zone, helping SOL climb back toward $68.47. The move represents a recovery of more than 13% from recent lows and has improved short-term market sentiment.
Several analysts identified the $60-$65 range as a critical accumulation zone. Recent market data shows that traders continue defending this level despite ongoing volatility across the crypto sector. The rebound also came as Bitcoin and other major cryptocurrencies stabilized after a broader market correction.
Why the Bounce Matters?
The recovery suggests that sellers may be losing control in the short term. Technical indicators have improved, and some traders are beginning to look for signs of a trend reversal.
However, the broader picture remains mixed. SOL still trades below several key moving averages, meaning bulls need further confirmation before claiming victory. For now, the bounce is encouraging, but it does not yet confirm a new uptrend.
The $77-$78 Resistance Zone Is the Real Test for Bulls
Former Support Turned Major Resistance
The most important level on Solana’s chart is currently the $77-$78 resistance zone. Earlier in 2026, this area acted as strong support. After the breakdown, it transformed into a major resistance barrier.
This type of price behavior is common in technical analysis. Traders who bought near those levels often sell when price revisits the area, creating strong overhead pressure.
What Happens if SOL Breaks Above $78?
A decisive breakout above $78 could significantly improve Solana’s outlook. Analysts believe such a move would:
- Trigger fresh buy signals.
- Attract new trading volume.
- Open the path toward $85 and potentially $90.
Some technical models suggest that reclaiming this level would also improve the medium-term trend structure and increase confidence among institutional investors.
Why Do Traders Remain Cautious?
Despite the recent rebound, caution remains justified. Solana continues trading below major trend indicators. Volume has not yet confirmed a strong bullish breakout, and several previous recovery attempts have failed near resistance.
Market participants are waiting for proof that buyers can absorb selling pressure around $77-$78 before turning aggressively bullish.
Key Technical Indicators Traders are Watching
Is RSI Signaling Stronger Momentum?
The Relative Strength Index (RSI) has improved from oversold conditions seen earlier this month. During the selloff, RSI readings approached levels often associated with market bottoms.
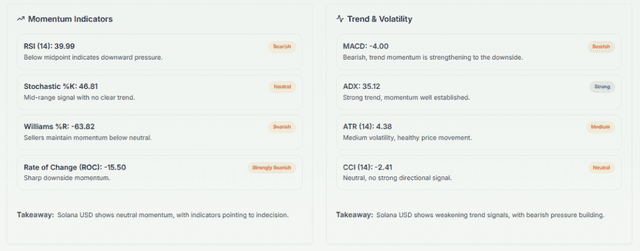
An improving RSI suggests momentum is shifting back toward buyers. However, the indicator has not yet entered strongly bullish territory.
Why Do Moving Averages Still Matter?
One of the biggest challenges facing SOL is its position below major moving averages. Current analysis shows Solana remains under the 20-day, 50-day, and longer-term averages.
This signals that the broader trend remains weak despite the recent recovery. Many professional traders view a move above these averages as necessary before increasing exposure.
Why Is Volume Confirmation Important?
Breakouts without volume often fail. Trading volume remains one of the most important indicators for confirming trend changes.
Investors using an AI stock analysis tool or crypto analytics platform often monitor volume alongside price action. If SOL breaks above resistance with rising volume, the move would carry much greater credibility.
Short-Term SOL Price Scenarios for the Coming Weeks
Bullish Scenario
If SOL successfully closes above $78, momentum could accelerate quickly. Analysts see potential upside targets between $85 and $90. A stronger breakout could eventually push prices closer to the psychological $100 level.
Bearish Scenario
Failure at resistance could trigger another pullback. In that case, traders would likely focus on support near $68, followed by the key $60-$65 zone. A break below $60 would significantly weaken the current recovery narrative.
Technical Analysis Summary
- Current support: $60-$65
- Immediate resistance: $77-$78
- Bullish target: $85-$90
- Key risk level: Below $60
- Trend status: Recovery underway, but confirmation pending
What Meyka Says?
At the time of writing, market-focused forecasting platforms generally remain neutral on SOL until resistance levels are reclaimed. The consensus view aligns with current technical data: Solana needs a confirmed breakout above the $77-$78 area before a strong buy signal emerges. Other analysts from FXEmpire and CoinStats share a similar outlook, emphasizing confirmation over speculation.
Conclusion
Solana has delivered an impressive rebound from the $60 support zone, but the recovery remains incomplete. The $77-$78 resistance area continues to be the market’s key battleground. A breakout above this level could unlock further gains toward $85 and beyond. Until then, traders should focus on volume, momentum indicators, and support strength. The next few weeks may determine whether SOL begins a new bullish phase or remains trapped in a broader consolidation pattern.
Disclaimer:
The content shared by Meyka AI PTY LTD is solely for research and informational purposes. Meyka is not a financial advisory service, and the information provided should not be considered investment or trading advice.
What brings you to Meyka?
Pick what interests you most and we will get you started.
I'm here to read news
Find more articles like this one
I'm here to research stocks
Ask Meyka Analyst about any stock
I'm here to track my Portfolio
Get daily updates and alerts (coming March 2026)