



Bitcoin Price Today: BTC Holds at $64,295 as Volatility Drops to 0.68%, Traders Eye $65,500 Breakout

Key Points
Bitcoin holds near $64,295: BTC remains range-bound as traders assess whether the current calm can lead to a stronger move.
Volatility falls to 0.68%: Extremely low volatility points to tight price action and could signal an upcoming breakout.
$65,500 is the key resistance: A sustained break above this level could strengthen the short-term bullish outlook for Bitcoin.
$64,000 remains crucial support: Holding this zone could protect BTC from deeper losses and keep the current recovery setup intact.
Bitcoin price today remains near $64,295 as of August 19, 2026, while volatility has fallen to just 0.68%. Bitcoin is trading within a narrow range, leaving traders focused on where the next move may come from. The $65,500 level is now a major resistance area, while support around $64,000 could help contain further losses. With price swings becoming smaller, BTC could be setting up for either a breakout or another pullback.
Bitcoin Price Today: BTC Trades Near $64,295
Bitcoin is holding close to $64,295 on August 19, 2026, with price action still confined to a narrow range. Investing.com puts the main resistance area between $65,000 and $65,600. Its analysis also places the 200-period moving average near $64,130, giving bulls a nearby level to defend.
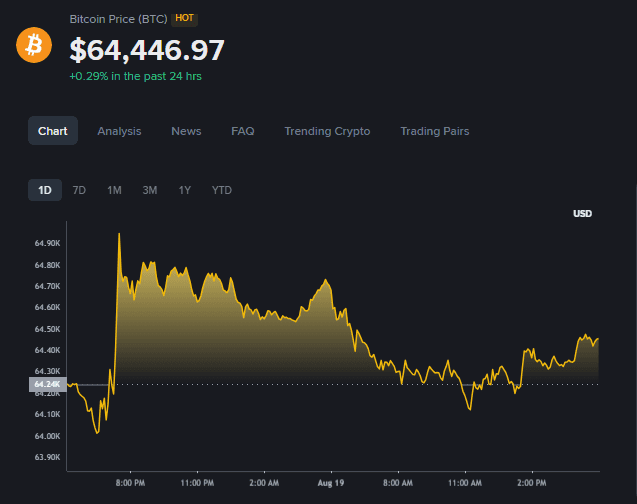
MEXC market data puts BTC at around $64,359, with a 24-hour gain of 0.36%. Its Fear & Greed reading stands at 41, which points to neutral sentiment rather than strong buying confidence.
The wider market is also cautious. Bitcoin recently moved lower alongside US equities as rising global bond yields put pressure on risk assets. Barron’s reported BTC at around $64,306, down 0.4% in the latest session.
Bitcoin Volatility Drops to 0.68%: What Does It Mean?
The sharp decline in short-term volatility is one of the main features of the current Bitcoin market. The five-hour chart shows volatility at just 0.68%, suggesting that buyers and sellers are closely matched.
Why could low volatility trigger a bigger BTC move?
When volatility falls this low, Bitcoin can enter a period of price compression. The market may stay quiet for a while before a stronger move takes shape.
Investing.com puts the ATR at about 438 points, reflecting the limited size of recent price swings. Its data also places the upper Bollinger Band near $64,913. That gives BTC another technical barrier to clear before it can challenge the $65,500 target.
Can Bitcoin Break $65,500?
What happens if BTC clears $65,500?
A sustained move above $65,500 would improve the short-term bullish setup. The level has acted as a ceiling for the current trading range. A breakout backed by higher trading volume would carry more weight than a brief move above resistance.
For now, traders are watching the $65,000 to $65,600 area closely. If sellers step in again, Bitcoin could remain stuck inside its current range.
What are the key Bitcoin support levels?
The first support area sits around $64,000 to $64,130. The 200-period moving average near $64,130 adds weight to this zone. If BTC falls below it, the $63,300 to $63,800 range becomes the next area to watch based on current technical analysis.
Bitcoin has also spent much of August around the low-$60,000 levels. Investing.com’s recent historical data shows BTC closed at $63,127.40 on August 13, after trading between $62,849 and $63,980 during that session.
Bitcoin Price Prediction: Bullish or Bearish?
Bullish scenario
The bullish setup depends on Bitcoin holding above $64,000 and then pushing through $65,500. If buying volume rises during the move, it could signal that the current period of consolidation is coming to an end.
Meyka’s earlier Bitcoin research also points to liquidity and institutional demand as factors to watch alongside technical levels. Its April analysis noted that Bitcoin remains sensitive to wider economic conditions, while institutional buying can support a longer-term recovery.
Bearish scenario
The bearish case would become stronger if BTC keeps failing near $65,500. A break below $64,000 could send the price towards the lower support areas. Weak equity markets and higher bond yields are also risks for Bitcoin because they can reduce demand for riskier assets.
What Meyka Says About Bitcoin’s Outlook?
Meyka’s available BTC research points to a mixed short-term outlook rather than a clear bullish call. Its April technical analysis looked at indicators including RSI, MACD, ADX, and Bollinger Bands to assess momentum and trend strength.
Meyka also combines price data, technical indicators, news, sentiment, and other market signals in its analysis. Its platform offers an AI-based crypto analysis tool that can help traders process large amounts of market information.
For the current setup, the levels are straightforward. $65,500 is the main upside test, while $64,000 is the first level bulls need to defend.
What are Other Analysts Watching?
Investing.com identifies $65,000 to $65,600 as the main resistance zone. Its analysis also points to a weakening ADX near 27.18, which suggests that the current trend does not have strong momentum. MACD remains positive, but there is still no confirmed breakout.
MEXC’s August 19 market snapshot puts the Fear & Greed score at 41. That reading suggests traders remain cautious and have not moved into strong bullish territory.
Bitcoin Technical Analysis Summary
The current setup comes down to three main price areas:
- Resistance: $65,000 to $65,600
- Immediate support: around $64,000 to $64,130
- Lower support: $63,300 to $63,800
Bitcoin remains range-bound. The low 0.68% volatility suggests that a larger price move may be developing, but it does not indicate which direction that move will take. Traders need to watch price, volume, and momentum together rather than assuming that low volatility automatically means Bitcoin is preparing to rise.
Conclusion
Bitcoin price today remains between a clear resistance zone and nearby support. BTC needs to move above $65,500 with stronger volume to confirm a bullish shift. Until that happens, the $64,000 area remains a level to watch. Higher bond yields and cautious market sentiment may continue to limit gains. The next decisive price move could provide a clearer signal than the current low-volatility trading range.
Disclaimer:
The content shared by Meyka AI PTY LTD is for research and informational purposes only. Meyka is not a financial advisory service, and the information provided should not be treated as investment or trading advice.
What brings you to Meyka?
Pick what interests you most and we will get you started.
I'm here to read news
Find more articles like this one
I'm here to research stocks
Ask Meyka Analyst about any stock
I'm here to track my Portfolio
Get daily updates and alerts (coming March 2026)