




Key Points
Bitcoin price hits $69,329 after a 20% recovery.
BTC bulls now target the $69,000-70,000 resistance zone.
A breakout above $70,000 could open the path toward $75,000.
Meyka highlights ETF flows, liquidity, and institutional demand as key BTC drivers.
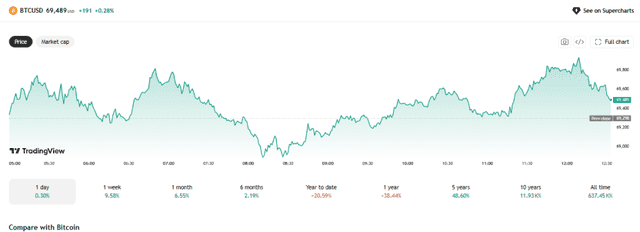
Bitcoin price has climbed more than 20% from its 2026 low, reaching around $69,329 as the recovery continues. On August 19, 2026, BTC moved above $68,000 and gained more than 6%, reaching its highest level in almost three months. The move has brought Bitcoin back to a major resistance area between $69,000 and $70,000. The next question is whether bulls can push through that zone and keep the rally going.
Bitcoin Price Reaches $69,329 as Recovery Accelerates
How Much Has Bitcoin Recovered From Its 2026 Low?
Bitcoin has recovered sharply from its 2026 low near $57,800. The rebound has taken BTC close to the $70,000 level. On August 19, 2026, Bitcoin rose more than 6% and traded above $69,000, reaching its highest level in almost three months. The move has also improved short-term market sentiment, which had been more defensive earlier in the year.
What Triggered Bitcoin’s Latest Rally?
Several factors helped drive the August 19 rally. The U.S. Treasury said it planned to double the maximum size of some long-term bond buybacks from $2 billion to $4 billion. Lower long-term yields also supported appetite for riskier assets. At the same time, more than $1 billion in Bitcoin short positions were liquidated within about an hour. Those liquidations added forced buying pressure as BTC moved higher.
BTC Bulls Face a Critical $69,000-70,000 Resistance Zone
Why Is $69,000 a Key Bitcoin Resistance Level?
The $69,000 to $70,000 range is a major test for Bitcoin bulls. The area combines a widely watched psychological level with resistance from earlier price action. Coinbase Institutional identified $69,000 as resistance in its August 7 market commentary, while also pointing to $67,000 and $71,000 as notable levels. Holding above this range would give the recovery more strength and reduce the chance that the move is driven mainly by a short squeeze.
What Happens If Bitcoin Breaks Above $70,000?
A clear move above $70,000 would improve Bitcoin’s technical setup. The next level traders could watch is around $71,000, followed by the $75,000 area if buying pressure remains strong. Earlier technical analysis also placed resistance around $69,000 to $70,500. A daily close above this range would carry more weight than a brief intraday move through resistance.
Bitcoin Technical Analysis: Key Support and Resistance Levels
BTC Resistance Levels to Watch
Bitcoin’s immediate resistance sits around $69,000 to $70,000. A sustained breakout could bring $71,000 into focus, with traders then looking toward $75,000. Coinbase Institutional’s recent analysis identified $67,000, $69,000 and $71,000 as levels worth watching. Price action around these areas can show whether BTC is building a lasting breakout or simply making another failed attempt higher.
BTC Support Levels to Watch
Support has moved higher as Bitcoin has recovered. The first level to watch is around $67,000. Below it, $63,000 becomes a more important area. Coinbase Institutional previously identified $63,000 and the $58,000 to $59,000 range as major support zones. If BTC falls below $67,000, the recent bullish setup could weaken and leave the price exposed to a deeper pullback.
Bitcoin Price Prediction: Can BTC Reach $75,000?
Bullish Scenario for BTC
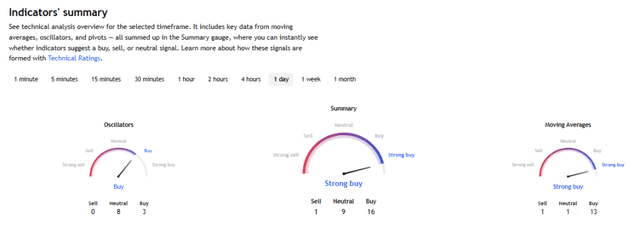
The bullish case depends on Bitcoin holding above $69,000 after testing resistance. Strong spot demand, better liquidity conditions and continued institutional interest could give BTC room to move higher. If Bitcoin breaks and holds above $70,000, $71,000 would become the next technical checkpoint. A sustained move through that level could put $75,000 within reach.
Bearish Scenario for Bitcoin Price
The bearish setup begins with a rejection around $69,000 to $70,000. After such a fast recovery, some traders may choose to take profits. A drop below $67,000 would weaken short-term momentum. Bitcoin could then revisit $63,000. If selling pressure increases further, the $58,000 to $59,000 support area could come back into focus.
What Meyka Says About Bitcoin’s Next Move?
Meyka’s recent Bitcoin research points to ETF flows, liquidity, macroeconomic conditions and institutional demand as major factors affecting BTC prices. Its August analysis previously placed resistance around $68,000 to $70,000 and support near $60,000 to $63,000.
Meyka’s earlier 2026 model also projected a year-end BTC price of about $97,868, although that forecast can change as market conditions develop. Its AI stock analysis tool can help investors track technical momentum, sentiment and other market signals.
What Should Bitcoin Investors Watch Next?
Investors should keep an eye on Bitcoin’s daily close above $70,000, along with ETF flows, liquidation activity and institutional demand. U.S. Treasury yields also deserve attention because changes in liquidity can affect risk assets quickly. BTC’s ability to stay above $67,000 after testing resistance will be just as important for the near-term setup.
Conclusion
Bitcoin’s recovery has brought the price back to a level where bulls face a serious test. The $69,000 to $70,000 resistance zone could determine whether BTC moves toward $71,000 and potentially $75,000. The recent rally was also boosted by heavy short liquidations, so one sharp move is not enough to confirm a breakout. A sustained move above resistance, backed by stronger demand, would offer a clearer bullish signal.
Disclaimer:
The content shared by Meyka AI PTY LTD is for research and informational purposes only. Meyka is not a financial advisory service, and the information provided should not be treated as investment or trading advice.
What brings you to Meyka?
Pick what interests you most and we will get you started.
I'm here to read news
Find more articles like this one
I'm here to research stocks
Ask Meyka Analyst about any stock
I'm here to track my Portfolio
Get daily updates and alerts (coming March 2026)