Key Points
Bitcoin holds above $81,000 amid strong ETF inflows and institutional demand.
Profit-taking and the strategy’s possible Bitcoin sales create short-term market pressure.
Key resistance lies at $82K-83K, while support is near $80K.
Analysts see potential for a breakout toward $90K-100K if momentum continues.
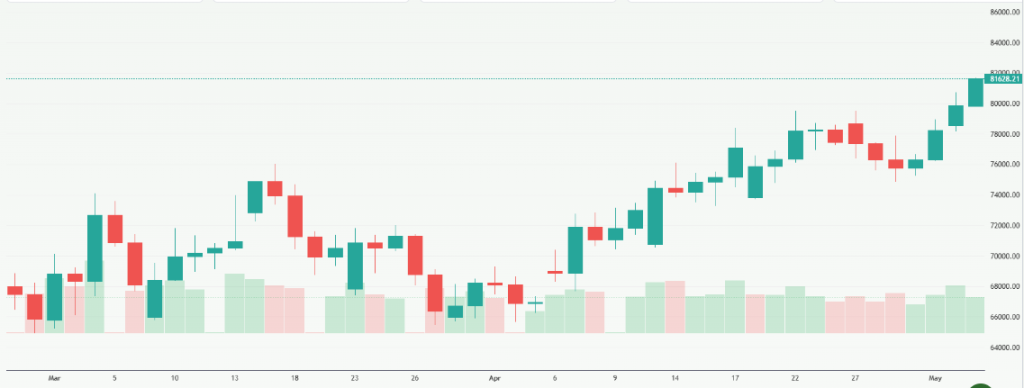
Bitcoin traded above $81,000 on May 6, 2026, marking one of its strongest levels in months. The rally followed heavy ETF inflows and renewed institutional demand. But gains quickly cooled after Strategy hinted it may sell part of its holdings. This shift has raised new questions in the market. Is Bitcoin ready for a breakout, or facing short-term pressure? Investors are now watching key levels closely as momentum slows.
Bitcoin Holds Above $81K: What’s Driving the Rally?
What is pushing Bitcoin above $81,000 in May 2026?
Bitcoin moved above $81,000 on May 6, 2026. This marks a strong recovery from April levels near $70,000. Several key drivers are behind this move.
ETF inflows and institutional demand
Spot Bitcoin ETFs saw strong inflows in early May. Data shows over $600 million in two days. Large asset managers continue to accumulate Bitcoin. This builds long-term confidence in the market.
Regulatory optimism improves sentiment
Progress around the U.S. crypto regulation framework, including the Clarity Act, supports the rally. Markets expect clearer rules for digital assets soon. This reduces uncertainty for institutions.
Macro environment supports risk assets
Global markets show signs of stability. Inflation concerns are easing slightly. This pushes investors toward risk assets like Bitcoin.
Why Bitcoin Is Struggling to Break Higher?
Resistance near $82K-83K
Bitcoin is strong, but not in a clear breakout yet. The market faces pressure at key levels.
Profit-taking by investors
Many traders bought Bitcoin near $70K. Now they are booking profits near $81K. On-chain data shows realized profits hitting monthly highs above $200 million.
Strong resistance zone
- Key resistance: $82,000-83,000
- The 200-day moving average sits near this range
This makes it hard for the price to move higher quickly.
Lack of breakout confirmation
Analysts say the rally needs stronger volume. Without it, Bitcoin may move sideways in the short term.
Strategy’s Potential Bitcoin Sale: Market Shock or Noise?
Is Strategy really planning to sell Bitcoin?
Yes, recent filings suggest that Strategy may sell part of its Bitcoin holdings if needed. This is a big shift in narrative.
Why would Strategy sell Bitcoin now?
Strategy holds over 800,000 BTC, making it the largest corporate holder. However, financial pressure is rising.
- The company reported a multi-billion-dollar quarterly loss in May 2026
- Loss driven by Bitcoin price fluctuations
- Debt obligations and dividend needs require liquidity
This forces the company to consider selling some assets.
How could this impact the market?
The actual selling volume may be small. But the signal matters more.
- Strategy was known for a “never sell” approach
- Any sale changes investor perception
- It may trigger short-term caution in the market
Still, analysts say the impact may be limited unless large volumes hit exchanges.
Technical Outlook: Key Levels to Watch
What are the key support and resistance levels?
Bitcoin is trading in a tight range. Traders are watching these levels closely:
Support levels
- $80,000 (psychological level)
- $78,900 (strong short-term support)
- $75,800 (100-day EMA)
Resistance levels
- $82,000-83,000 (immediate barrier)
- Break above this could push the price to:
- $89,000
- $94,000
- $100,000 (major milestone)
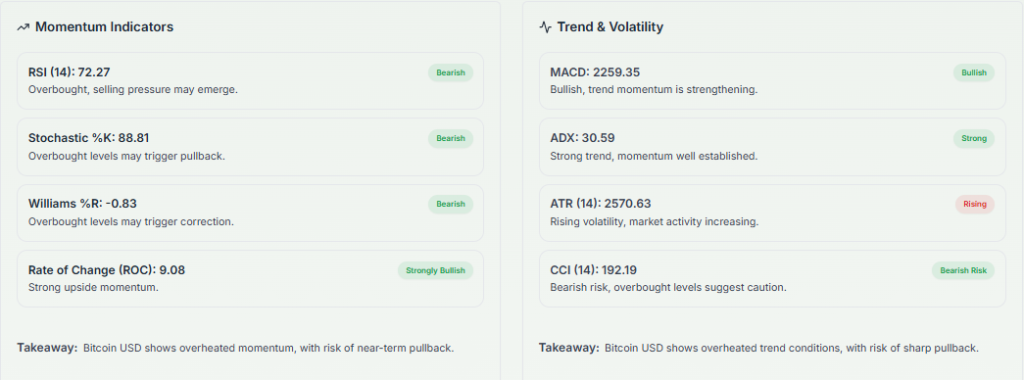
What do indicators suggest?
- RSI is near 65
- This shows bullish momentum
- But not overbought yet
This means Bitcoin still has room to move up if buying continues.
Broader Crypto Market Reaction
How are altcoins reacting to Bitcoin’s move?
Altcoins are following Bitcoin, but at a slower pace.
- Ethereum and Solana show moderate gains
- XRP remains stable with slight upside
- Bitcoin dominance is above 61%
This shows that capital is flowing more into Bitcoin than altcoins.
Is a short squeeze driving the rally?
Yes, short liquidations played a role.
- Over 100,000 traders liquidated in 24 hours
- This added buying pressure
- Helped push Bitcoin above $81K
What Comes Next for Bitcoin?
Can Bitcoin reach $100K in 2026?
There is a strong bullish case if key factors align:
- Continued ETF inflows
- Positive regulatory updates
- Break above $83K resistance
If this happens, Bitcoin could move toward $90K-100K.
What risks should investors watch?
- Institutional selling (like Strategy)
- Profit-taking near highs
- Global macro uncertainty
- Interest rate changes
Bitcoin Price Forecast and Analysis – Meyka Insights
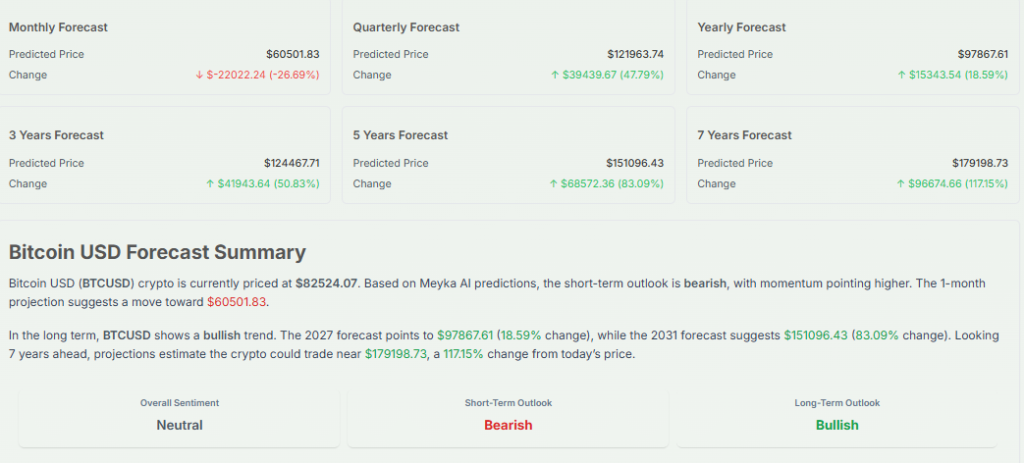
Short-Term Forecast from Meyka.com
- Bitcoin expected to trade between $78K-85K in the near term
- Breakout depends on sustained volume above $83K
Technical Analysis Summary
- Trend: Bullish but consolidating
- Momentum: Positive
- Resistance: Strong near $83K
- Support: Stable near $80K
What Meyka Says?
Meyka highlights that Bitcoin is in a “decision zone.” A breakout will confirm the next bull run phase. Failure may lead to short-term consolidation.
Supporting Analyst Insights
- Market analysts point to ETF inflows as a key driver
- On-chain data shows strong holder confidence
- Some warn of volatility due to institutional repositioning
Using an AI stock analysis tool helps track real-time signals, technical levels, and sentiment shifts in fast-moving markets like crypto.
Final Words
Bitcoin remains strong above $81K, but the market is at a turning point. ETF inflows and positive sentiment support the upside. At the same time, resistance near $83K and the strategy’s potential selling create pressure. A confirmed breakout could drive the next rally toward $100K, while failure may lead to short-term consolidation before the next move.
Disclaimer:
The content shared by Meyka AI PTY LTD is solely for research and informational purposes. Meyka is not a financial advisory service, and the information provided should not be considered investment or trading advice.
What brings you to Meyka?
Pick what interests you most and we will get you started.
I'm here to read news
Find more articles like this one
I'm here to research stocks
Ask Meyka Analyst about any stock
I'm here to track my Portfolio
Get daily updates and alerts (coming March 2026)