
Key Points
Adani Power share price fell 1.84% to ₹222 in the latest trading session.
Trading volume crossed 71 lakh shares, indicating strong market activity.
₹220 remains a key support level, while ₹225-230 is the immediate resistance zone.
Analysts advise tracking technical signals, earnings, and sector trends before making investment decisions.
Adani Power Ltd stayed in the spotlight on July 13, 2026, after its share price fell 1.84% to ₹222, while trading volume crossed 71 lakh shares. A jump in trading activity like this usually points to strong participation from both buyers and sellers, making the stock one of the most closely tracked counters during the session.
The latest price movement has raised questions about whether investors are booking profits or simply adjusting their positions in response to market conditions.
Adani Power Share Price Falls 1.84% Amid Heavy Trading Activity
What happened in the latest trading session?
Adani Power Ltd closed the session at ₹222, down 1.84%, with trading volume rising above 71 lakh shares. When a stock falls on higher-than-normal volume, it generally indicates active participation from the market rather than a lack of interest. Such moves often result from profit booking, portfolio rebalancing, or traders taking fresh positions.
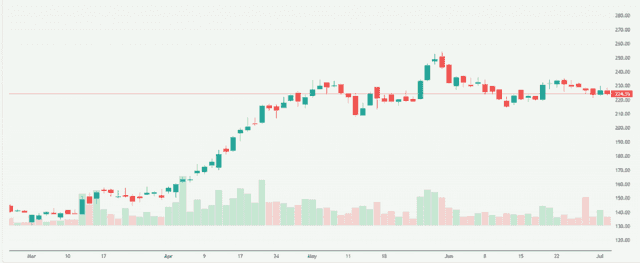
The stock was among the most actively traded on the NSE as investors kept an eye on overall market sentiment and movement within the power sector. It also underperformed the benchmark indices during the day, suggesting that traders remained cautious despite the heavy volume.
What Triggered the Spike in Trading Volume?
Why did investors trade so heavily?
A few factors may have contributed to the sharp increase in trading activity.
- Short-term traders booked profits after recent price fluctuations.
- Fresh buying emerged near technical support levels.
- Volatility across Indian power stocks encouraged more trading.
- Institutional investors may have adjusted their holdings ahead of upcoming corporate developments.
High trading volume alone does not confirm that the stock is about to reverse direction. It simply shows that buyers and sellers were both active throughout the session. Investors should look at price trends, company fundamentals, and sector performance alongside volume before making investment decisions.
Recent market data also shows that Adani Power has witnessed strong turnover in several trading sessions, indicating that investor interest has remained steady despite short-term price swings.
How Adani Power Is Performing Against the Broader Market?
Is the weakness company-specific or sector-driven?
Adani Power’s latest decline comes as several energy stocks continue to trade with mixed momentum. Investors have been reacting to factors such as global energy prices, interest rate expectations, and domestic economic developments, all of which have influenced sentiment across the sector.
Although the stock has pulled back from its recent highs, it remains well above its 52-week low. That suggests the longer-term trend has not completely changed. Many analysts continue to separate short-term price weakness from the company’s earnings outlook and expansion plans.
Comparing Adani Power with other listed power companies can provide a clearer picture of whether the recent weakness is specific to the company or reflects broader sector sentiment.
Technical Outlook: Key Levels Investors Should Watch
What does the technical picture suggest?
Technical indicators currently paint a mixed picture. Short-term momentum has weakened, although several long-term moving averages continue to support the overall trend. Traders are watching the ₹220 level closely, as it remains an important support zone. If the stock slips below this level and stays there, selling pressure could increase. A move above ₹225 to ₹230 may improve short-term sentiment.
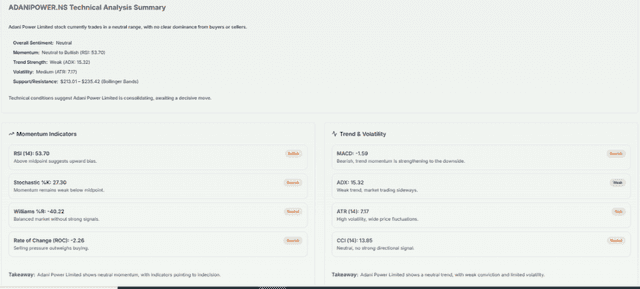
According to Meyka’s AI stock analysis tool, Adani Power is still moving through a consolidation phase rather than showing signs of a confirmed bullish reversal. The platform recommends waiting for stronger volume confirmation before taking fresh positions. Other technical research platforms, including Investing.com, currently classify the stock as a short-term “Sell” or “Strong Sell” because momentum indicators remain weak.
What Meyka says?
Meyka’s technical analysis suggests that Adani Power is still consolidating around current levels. The platform advises investors to monitor price action near support before expecting a stronger directional move. Its AI-based assessment indicates that patience may be a better approach until momentum improves.
What This Means for Investors?
Should investors worry?
A single day’s decline does not change the company’s long-term story. The sharp increase in trading volume shows that Adani Power continues to attract attention from both traders and investors. Those with a long-term view may want to focus on quarterly earnings, electricity demand, expansion projects, and debt levels instead of reacting to daily price movements. Short-term traders, meanwhile, may prefer to wait until technical indicators show stronger momentum.
Conclusion
Adani Power ended the session at ₹222 after falling 1.84%, while trading volume climbed above 71 lakh shares. The combination of lower prices and higher trading activity points to active participation rather than panic selling. Short-term momentum remains under pressure, but the stock continues to draw investor interest.
Keeping an eye on support levels, upcoming earnings, and trends across the power sector should help investors assess whether the current decline is a temporary pullback or part of a longer correction.
Disclaimer:
The content shared by Meyka AI PTY LTD is for research and informational purposes only. Meyka is not a financial advisory service, and the information provided should not be treated as investment or trading advice.
What brings you to Meyka?
Pick what interests you most and we will get you started.
I'm here to read news
Find more articles like this one
I'm here to research stocks
Ask Meyka Analyst about any stock
I'm here to track my Portfolio
Get daily updates and alerts (coming March 2026)