Bitcoin is trading above $74,000 in today’s session on April 15, 2026. The market shows steady strength after recent gains in global risk appetite. Investors are reacting to growing hopes of US-Iran peace talks, which have improved overall financial sentiment. As tensions ease, traders are moving back into risk assets, including cryptocurrencies.
Bitcoin has remained stable near the $74K range after briefly testing higher levels earlier this week. The move reflects a shift in investor confidence and stronger demand for digital assets. Many market participants are now watching whether this momentum can continue or fade in the coming days. The crypto market is once again closely tied to global geopolitical developments.
Advertisement
Bitcoin Price Action Above $74,000: What Is Driving the Market Right Now?
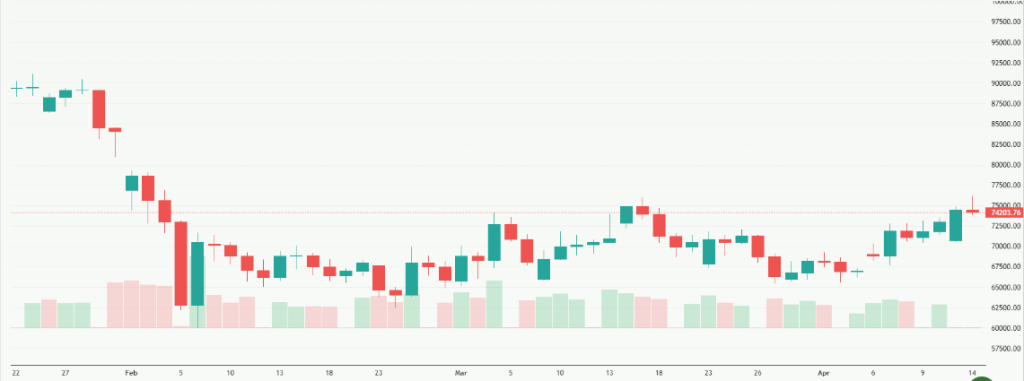
Bitcoin is trading in a strong consolidation phase around the $74,000 level as of April 15, 2026. The price briefly moved toward the $75,500–$76,000 range before facing mild selling pressure. This movement reflects a balance between bullish sentiment and short-term profit-taking.
The main driver behind the recent strength is improving global risk sentiment. Markets are reacting to early signals of easing geopolitical tension, especially renewed discussions around US-Iran diplomatic engagement. According to recent market commentary from major financial news desks like Reuters and CoinDesk, investors are rotating back into risk assets, including crypto.
Bitcoin is now showing higher lows on short-term charts, which suggests that buyers are still active despite volatility.
What is the key support and resistance zone for Bitcoin?
Bitcoin is currently moving inside a well-defined trading range. Key levels include:
- Support zone: $72,000 to $73,500
- Immediate resistance: $75,500 to $76,000
- Breakout target: $78,000 to $80,000 if momentum continues
The price structure shows consolidation after a sharp upward move. This often happens when the market pauses to absorb gains before the next trend.
Short-term volatility remains high, mainly due to leveraged trading in derivatives markets. However, the overall structure still leans slightly bullish as long as support holds above $72K.
Why are US-Iran peace hopes affecting Bitcoin prices?
Geopolitical developments are playing a major role in today’s crypto market.
As discussions around US-Iran relations show early signs of progress, global investors are becoming more confident. This reduces demand for safe-haven assets like gold and the US dollar and increases appetite for risk assets such as equities and cryptocurrencies.
Key effects include:
- Improved global risk sentiment
- Lower fear of geopolitical escalation
- Stronger inflows into tech and crypto markets
- Stabilization in oil prices, reducing inflation concerns
Bitcoin is increasingly reacting like a macro-risk asset. This means it moves alongside global equities, especially tech-heavy indices like the Nasdaq.
Are institutional investors still buying Bitcoin?
Yes, institutional participation remains a strong support factor in this rally. Spot Bitcoin ETFs continue to attract steady inflows, according to market data tracked by CoinMarketCap and ETF flow reports widely covered in financial media. This consistent demand helps reduce downside pressure.
Institutional trends include:
- Continued ETF inflows from hedge funds and asset managers
- Reduced selling pressure from long-term holders
- Strong accumulation during dips
- Improved liquidity in major exchanges like Coinbase
This pattern shows that large investors are not exiting the market. Instead, they are using volatility to accumulate positions.
How is Bitcoin linked to global stock markets right now?
Bitcoin is showing a high correlation with global equity markets in 2026.
When stock markets rise, especially US tech stocks, Bitcoin often follows. This is due to shared investor behavior driven by liquidity and risk appetite.
Key observations:
- Bitcoin moves closely with the Nasdaq index
- Risk-on sentiment supports both crypto and tech stocks
- Lower interest rate expectations improve market liquidity
- Investors treat Bitcoin as a high-growth digital asset
This relationship shows that Bitcoin is no longer isolated. It is now part of the broader global financial risk cycle.
What are the risks behind Bitcoin’s current rally?
Even though the trend looks positive, risks still remain.
The biggest short-term risks include:
- Sudden reversal in geopolitical negotiations
- Strong US inflation data affecting rate expectations
- High leverage in crypto derivatives markets
- Profit-taking near resistance zones
Liquidation events can also cause sharp price swings. When leveraged traders are forced out, Bitcoin can move quickly in either direction. This is why traders are closely watching the $72K support zone.
Bitcoin technical outlook: What comes next?
From a technical perspective, Bitcoin is in a consolidation phase after a strong breakout. A simple breakdown of the trend:
- Bullish structure remains intact above $72K
- Momentum is slowing near $75K–$76K resistance
- The market is waiting for a clear breakout or rejection
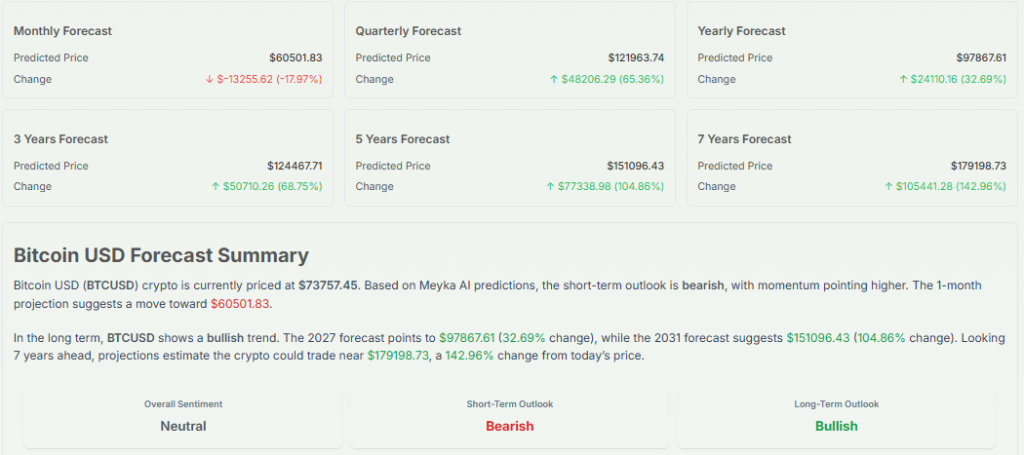
If Bitcoin breaks above $76,000 with volume, the next target could be $78,000 to $80,000. However, failure to hold current levels may lead to a retest of $70,000-$72,000.
AI-driven market insights and Meyka-style analysis overview
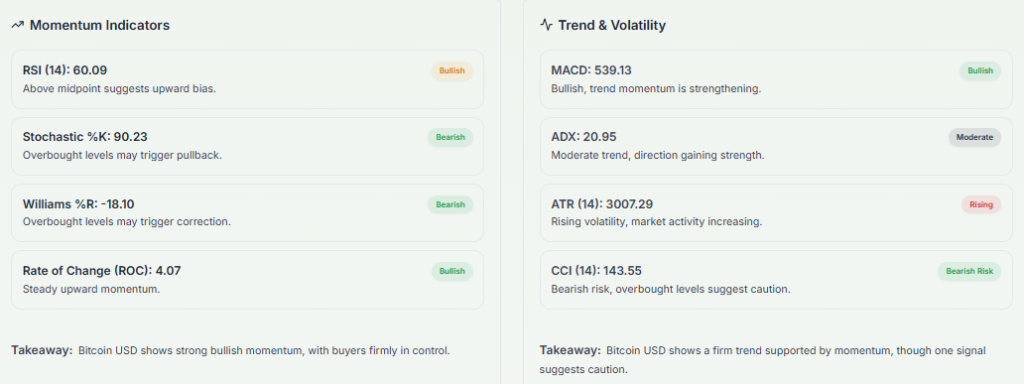
AI-based market analysis tools, including platforms similar to Meyka.com style financial intelligence systems, suggest that Bitcoin remains in a “moderate bullish momentum phase.” These tools typically evaluate price trends, sentiment data, and macro signals together.
Key AI-driven insights include:
- Positive sentiment from geopolitical easing
- Strong accumulation signals from institutional wallets
- Neutral-to-bullish momentum in short-term indicators
- Increased volatility risk near resistance zones
These AI models highlight one key point: trend strength is improving, but confirmation above resistance is still needed for a new breakout phase.
What are other analysts saying about Bitcoin?
Market analysts remain divided but generally optimistic.
- Bullish analysts expect continued upside if ETF inflows remain strong
- Neutral analysts predict sideways movement between $72K-$76K
- Cautious analysts warn of sharp corrections if global news turns negative
Most agree that macro conditions, not just technicals, are now driving Bitcoin more than ever.
Wrap Up
Bitcoin holding above $74,000 reflects strong market confidence supported by easing geopolitical tension and steady institutional demand. However, resistance near $76,000 remains a key hurdle. The next major move will depend on whether global sentiment continues to improve or shifts back to risk aversion.
Disclaimer:
The content shared by Meyka AI PTY LTD is solely for research and informational purposes. Meyka is not a financial advisory service, and the information provided should not be considered investment or trading advice.
Advertisement
What brings you to Meyka?
Pick what interests you most and we will get you started.
I'm here to read news
Find more articles like this one
I'm here to research stocks
Ask Meyka Analyst about any stock
I'm here to track my Portfolio
Get daily updates and alerts (coming March 2026)