


On March 6, 2026, Indian stock markets opened on a shaky note as the BSE Sensex dropped over 500 points and the NIFTY50 slid below the key 24,650 level in early trading. This sharp move came after a mixed session on March 5, when markets briefly rebounded, but sentiment remained fragile. Traders and investors on Dalal Street are watching geopolitical tensions in West Asia and higher global oil prices closely, as these factors continue to influence risk appetite and market direction.
The early sell‑off has put renewed focus on key sectors and global cues shaping investor confidence. With volatility running high, many are left wondering what this means for the rest of the week’s trading ahead.
India Stock Market Snapshot: Sensex & Nifty Today
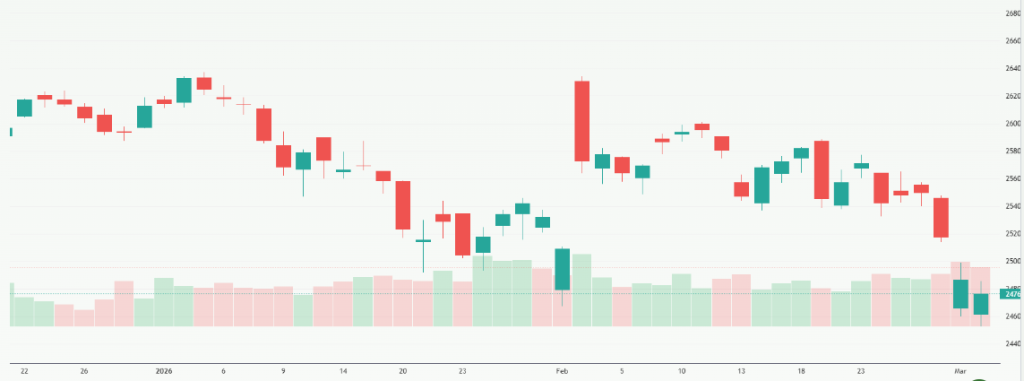
The Indian equity market opened sharply lower on Friday, March 6, 2026, with benchmark indices sliding early in the session. The BSE Sensex fell more than 500 points, dipping toward the 79,400-79,500 zone, while the NIFTY50 slipped below the key 24,650 level in opening trade.
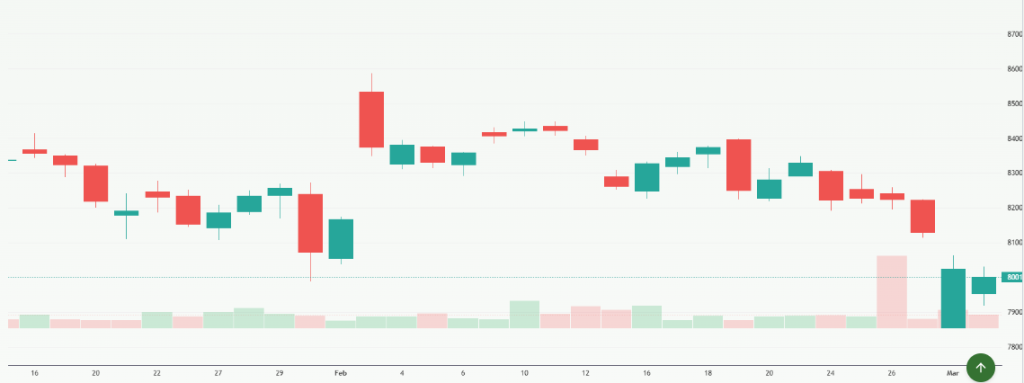
At around 9:18 AM IST, market data showed Nifty trading near 24,610, down more than 150 points, and Sensex down around 0.66% compared with the prior session’s close. This drop came right after a brief rebound on March 5, when Sensex had surged nearly 900 points, and Nifty reclaimed the 24,750 area amid optimism over potential easing in Middle East tensions.
Markets gave up part of those gains on Friday as global cues weakened. Volatility resumed, with financial and bank stocks among the early drags, while IT and select defensive sectors showed relative strength.
Foreign portfolio investors (FPIs) continued to trim exposure significantly, even as domestic institutional investors (DIIs) offered limited buying support. Weak global risk sentiment, the ongoing US-Israel-Iran conflict, and higher crude prices pressured equities, pushing both Sensex and Nifty into red territory.
What are the Key Drivers Behind the Fall?
Geopolitical Tension and Oil Price Shock
Rising geopolitical hostilities in the Middle East, especially the escalating conflict involving Iran, the US, and Israel, have heavily influenced global markets. These tensions have lifted crude oil prices to multi‑month highs, raising inflation concerns in export‑dependent economies. India, as a major oil importer, is particularly sensitive to crude price surges, since higher energy costs can erode corporate margins and slow economic growth.
Weak International Cues
Global markets were weighed down by broad risk‑off sentiment. Major indices in the United States closed lower the previous day, and Asian equities reflected weakness early on Friday as investors shifted capital toward safe‑haven assets like bonds and the US dollar. This global risk aversion often translates into selling pressure on emerging markets such as India.
Continued FPI Selling
Foreign portfolio investors (FPIs) have been net sellers in recent sessions, withdrawing funds from Indian equities. Provisional data show FPIs sold shares worth significant amounts, adding to domestic selling pressure even as domestic institutional investors (DIIs) tried to cushion the decline.
Sector Weakness
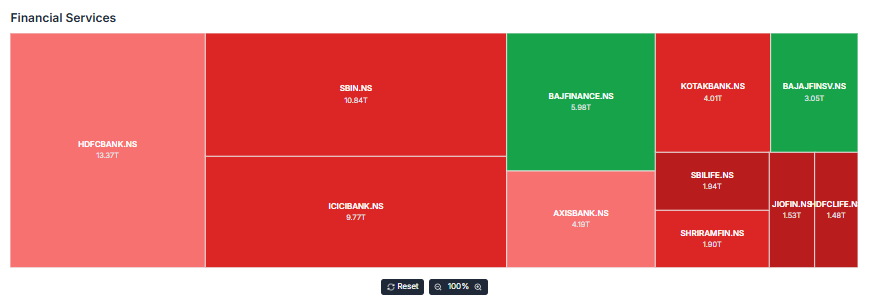
Not all sectors fell equally. Financials and banks, including heavyweights like ICICI Bank and HDFC Bank, were among the top drags on the benchmark. Industrials such as Larsen & Toubro and aviation names like IndiGo also weakened early in the session. Some defensive areas, like IT stocks, posted modest gains, reflecting rotation rather than uniform selling.
Indian Stock Market Today: What Does This Mean for Investors?
Is the Downtrend Likely to Continue?
The latest slide suggests that volatility may persist in the near term. Technical analysts note that 24,600-24,300 remains a critical support range for Nifty. A break below this zone could invite further selling, while a bounce back above 24,900-25,000 might signal renewed buyer interest, according to recent technical forecasts.
Short‑Term Trading vs Long‑Term Investing
Short‑term traders should watch momentum indicators and volume patterns closely, as early bearish momentum could signal continued pressure through the day. However, longer‑term investors should focus on fundamentals rather than short‑term price swings. Key global cues such as easing geopolitical tension or stabilization in crude prices could help markets recover.
Emerging Opportunities
Market analytics platforms and AI‑powered tools like advanced stock analysis on Meyka.com, suggest some defensive and IT stocks may see relative strength amid volatility, offering tactical entry points for patient investors.
Sector Impact & Trending Indicators
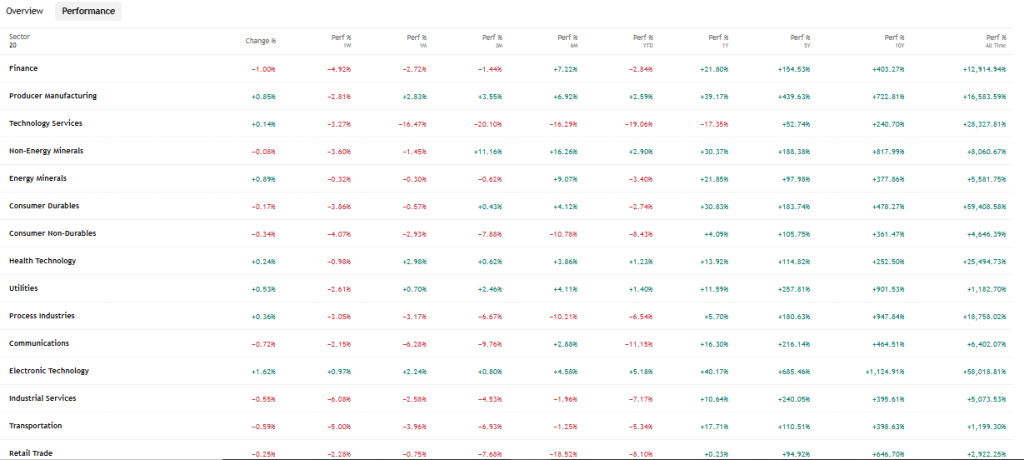
Financial and banking stocks have borne the brunt of the recent decline, dragging headline indices. However, the IT and pharmaceutical sectors have shown resilience, hinting at selective buying amid broad risk‑off sentiment. Continued FPI selling and elevated crude prices add to market headwinds, while domestic institutional activity offers some support.
The volatility index (India VIX) often rises when risk appetite falls. Recent patterns show VIX elevated above average, signaling trader caution and choppy price action ahead. Investors should watch global oil price trends, US bond yields, and Middle East developments closely, as these could dictate market direction in the coming sessions.
What Experts are Saying about Sensex Today’s Performance?
Market analysts link the sell‑off to geopolitical uncertainty and risk‑off global sentiment. Some believe the recent rebound on March 5 was a relief rally rather than a strong trend reversal, suggesting markets remain under pressure until global cues improve. Technical analysts highlight key support and resistance zones for near‑term trading, cautioning that markets may remain range‑bound unless major news lifts risk appetite.
Despite the turbulence, some analysts note that oversold conditions could attract bargain hunters, potentially stabilizing markets if crude prices cool and geopolitical risk eases. However, near‑term volatility is expected to stay elevated amid global uncertainty.
Final Words
The early‑session drop in Sensex and Nifty reflects deep investor caution driven by rising global tensions, crude price pressures, and weak international leads. In such an unsettled environment, markets are likely to stay volatile. Smart investors should track key support levels and global cues while avoiding knee‑jerk reactions to short‑term moves. Patience and strategy remain the keys to navigating choppy times.
Frequently Asked Questions (FAQs)
On March 6, 2026, Sensex fell over 500 points. Weak global markets, rising oil prices, geopolitical tensions in the Middle East, and foreign investor selling put pressure on Indian stocks today.
Nifty slipped below 24,650 on March 6, 2026. Selling by banks and financial stocks, global uncertainty, and crude price rise caused this drop in early trading sessions.
On March 6, 2026, key Sensex support levels are around 79,200-79,000. If it falls below this range, more selling may happen, while a rebound may start near these levels.
Disclaimer:
The content shared by Meyka AI PTY LTD is solely for research and informational purposes. Meyka is not a financial advisory service, and the information provided should not be considered investment or trading advice.
What brings you to Meyka?
Pick what interests you most and we will get you started.
I'm here to read news
Find more articles like this one
I'm here to research stocks
Ask our AI about any stock
I'm here to track my Portfolio
Get daily updates and alerts (coming March 2026)