Zip Co Ltd shares on the ASX plunged nearly 33% on February 19, 2026, sending shockwaves through the Australian stock market. The sharp fall came just hours after the buy now, pay later firm released its half-year FY26 financial report, which showed strong revenue growth and a big jump in profit. At first glance, the numbers looked solid. Yet investors focused on one key detail, flat earnings guidance for the second half.
That single line triggered heavy selling and pushed Zip into one of its worst trading sessions in months. The sudden drop has left traders and long-term investors asking the same question: was this a market overreaction, or a warning sign of slower growth ahead? The answer could shape Zip’s next move.
Advertisement
What Happened to Zip Shares Today?
Why did Zip shares crash on February 19, 2026?
Zip Co Ltd (ASX: ZIP) shares collapsed up to 38-40% on February 19, 2026, after the company released its half-year FY26 earnings report. The stock fell to an intraday low of A$1.72, its weakest level since May 2025, making it one of the worst performers of the February earnings season.
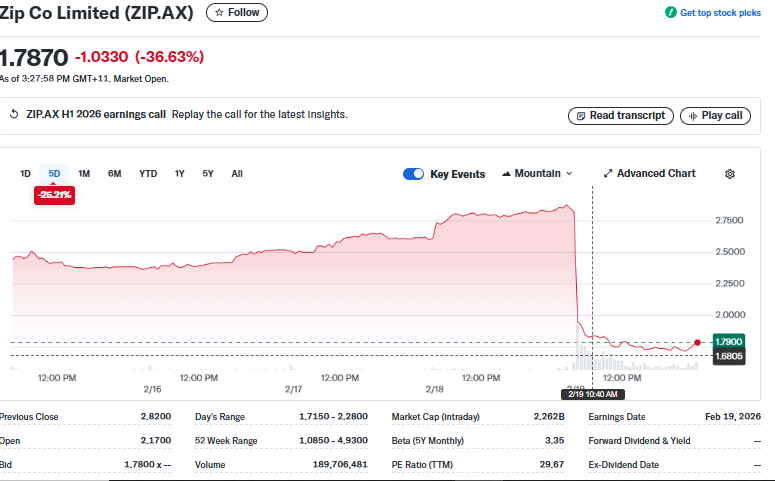
Trading volume surged to over 166 million shares, far above its daily average of around 15 million, showing panic selling and institutional exit.
The sharp fall surprised many investors. Zip reported strong profit growth, rising revenue, and expanding margins. Yet the market focused on flat second-half earnings guidance, which signaled slower momentum ahead.
Key data snapshot (Feb 19, 2026):
- Share price low: A$1.72
- Intraday fall: -38% to -40%
- Trading volume: 166+ million shares
Key Highlights from Zip’s Half-Year FY26 Report
What did Zip report for the first half of FY26?
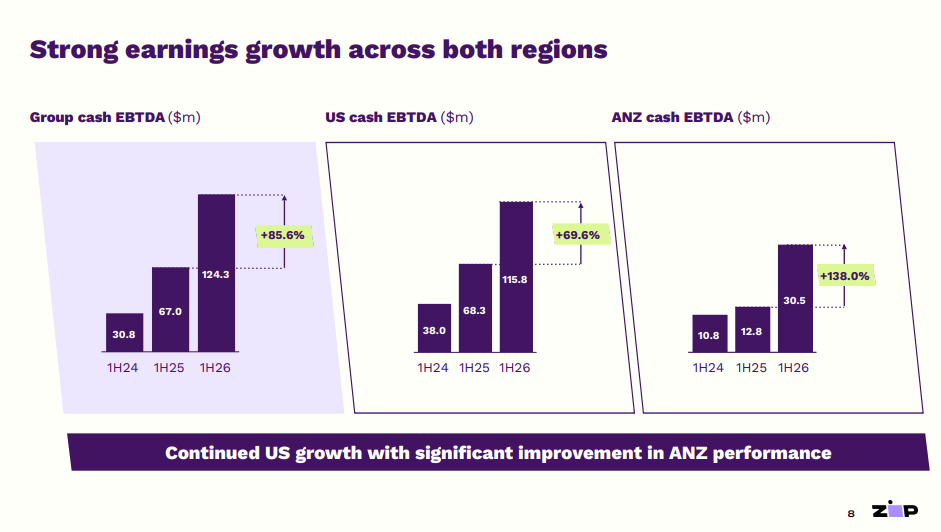
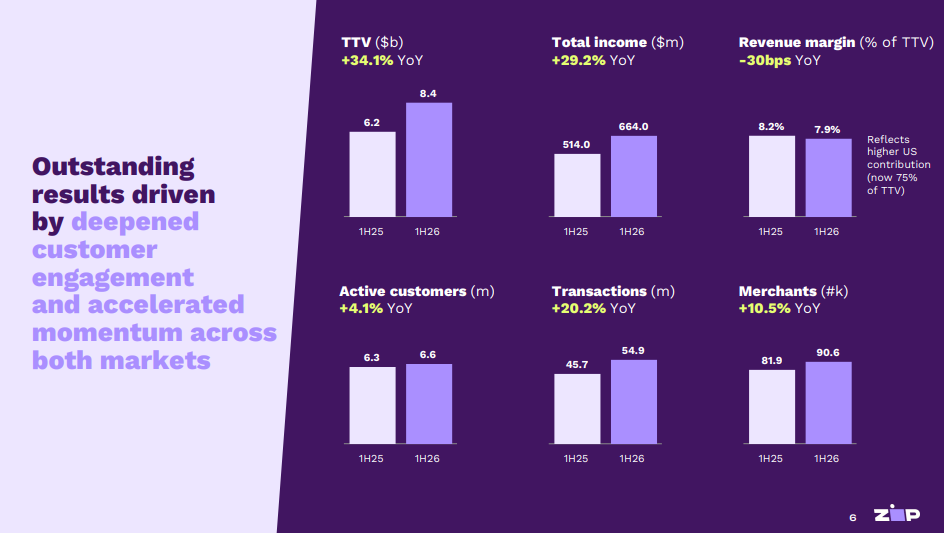
Zip delivered strong financial growth over the six months ended December 31, 2025, driven primarily by its expanding US business.
Key financial results:
- Total Transaction Volume (TTV): A$8.4 billion (+34.1%)
- Revenue: A$664 million (+29.2%)
- Cash EBITDA: A$124.3 million (+85.6%)
- Operating margin: 18.7%, up from 13% last year
- Net profit from continuing operations: A$52.4 million (+128%)
The company also reported:
- 54.9 million transactions (+20.2%)
- 6.6 million active customers (+4.1%)
- 90,600 merchants (+10.5%)
Despite these strong numbers, investors focused more on future earnings outlook than backward-looking performance.
Why Did Zip Shares Crash Despite Strong Profits?
Was weak guidance the main trigger?
Yes. The biggest concern for investors was Zip’s statement that second-half FY26 cash EBITDA would be “broadly in line” with the first half. Markets had expected strong sequential growth, driven by:
- Seasonal consumer spending
- Continued US market expansion
- Improving margins
Instead, Zip suggested profit momentum could stall, which triggered aggressive selling.
Did margins and bad debts add pressure?
Yes. While operating margins improved overall, Zip reported:
- Revenue margin dipped to 7.9%, down from 8.2%
- Net bad debts rose to 1.73% of TTV, compared to 1.56% last year
Although these figures remain within company targets, they raised concerns about rising credit risk, especially in a high-interest environment.
How Does This Compare with Zip’s Past Performance?
Has Zip faced similar sell-offs before?
Yes. Zip shares have a history of sharp rallies followed by steep corrections.
- In 2024, Zip shares surged over 360% as profitability improved.
- In 2025, the stock became highly volatile due to regulatory concerns and slowing consumer demand.
- In August 2025, Zip shares jumped 25% after reporting strong earnings and announcing a potential US listing plan.
Now, in February 2026, a flat earnings outlook reversed market optimism almost overnight.
What changed in 2026?
The business remains profitable. However, growth expectations reset lower, which forced investors to quickly reprice the stock.
Investor Sentiment & Analyst Outlook After the Crash
Is this a buying opportunity or a value trap?
Analyst views remain divided.
Bullish arguments:
- US business continues to grow at over 40% TTV growth.
- Operating margins are expanding.
- Profitability is now structurally stronger than before.
Bearish concerns:
- Flat guidance suggests a growth slowdown.
- Credit losses may rise if consumer conditions weaken.
- The BNPL sector faces regulatory risks in Australia and the US.
Short-term volatility is expected to remain high until clear growth signals emerge.
Zip Stock Forecast, Technical Outlook & What Meyka Says
Short Stock Details and Forecast
- Ticker: ASX: ZIP
- Price (Feb 19, 2026): ~A$1.72
- Trend: Strong bearish momentum
- Short-term outlook: Volatile with downside risk
- Medium-term outlook: Recovery possible if earnings guidance improves
Technical Analysis Summary via Meyka.com
According to Meyka’s AI stock analysis tool, Zip has entered a strong bearish trend zone, with momentum indicators showing heavy selling pressure.
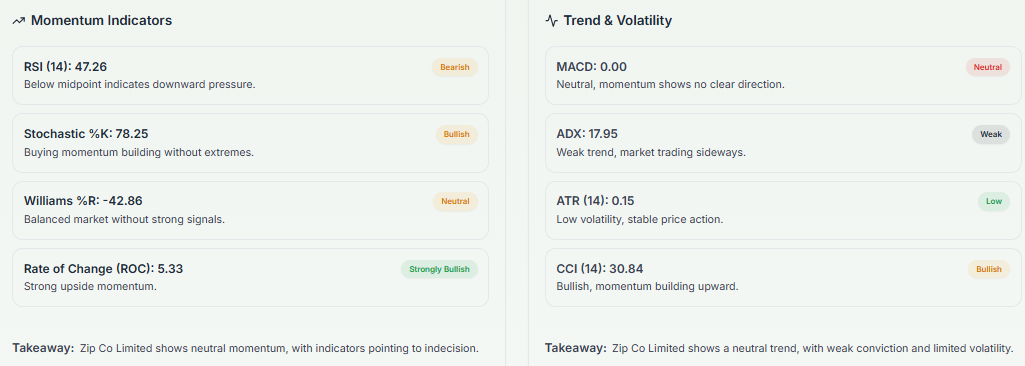
Key technical signals:
- RSI below 30, indicating oversold conditions
- Price trading well below 50-day and 200-day moving averages
- High volatility suggests possible short-term rebounds, but the trend remains weak
What Meyka Says
Meyka notes that Zip’s long-term growth potential remains intact, especially in the US market. However, it warns that earnings visibility and credit risk will determine future price direction.
Supporting insights from market analysts highlight that Zip must restore earnings momentum to regain investor trust.
What does this mean for ASX Tech & BNPL Stocks?
Zip’s collapse sent a strong message across the ASX fintech and BNPL sector. Investors are now demanding:
- Predictable earnings
- Clear growth visibility
- Strong risk control
High-growth stocks without firm guidance are facing instant repricing. This shift shows the market is now prioritizing profit stability over expansion promises.
Conclusion – Is Zip’s 33% Crash an Overreaction or a Warning?
Zip’s sharp sell-off reflects market fear, not business failure. The company continues to deliver strong revenue growth and rising margins. However, flat earnings guidance changed investor expectations instantly.
Short-term volatility is likely to stay high. Long-term recovery will depend on Zip’s ability to reignite growth, control credit risk, and strengthen guidance clarity.
For investors, Zip now represents a high-risk, high-reward opportunity, with its next earnings update likely to define its market direction.
Advertisement
Frequently Asked Questions (FAQs)
Zip shares fell 33% on February 19, 2026, after its half-year FY26 report. Investors reacted to flat earnings guidance, signaling slower growth despite strong revenue and profit numbers.
After the February 19, 2026, crash, Zip remains risky. Growth potential exists in the US market, but flat guidance and credit risks make short-term gains uncertain for investors.
Zip’s FY26 half-year report shows strong profit and revenue growth. However, flat second-half guidance warns of slower momentum. Investors should watch future updates before making decisions.
Disclaimer:
The content shared by Meyka AI PTY LTD is solely for research and informational purposes. Meyka is not a financial advisory service, and the information provided should not be considered investment or trading advice.
Advertisement
What brings you to Meyka?
Pick what interests you most and we will get you started.
I'm here to read news
Find more articles like this one
I'm here to research stocks
Ask our AI about any stock
I'm here to track my Portfolio
Get daily updates and alerts (coming March 2026)