


XRP once again ran into a wall at the $1.60 resistance level in March 2026, only to be pushed back by sellers. This price rejection came after a brief attempt to rally above that zone, leaving traders cautious and markets watching closely.
The move highlights growing bearish pressure in the crypto market, even as broader digital assets like Bitcoin and Ethereum face volatility tied to macro forces like interest‑rate policy and risk sentiment. With XRP struggling to hold gains above key technical thresholds, investors are asking whether this pullback is a short‑term correction or the start of a deeper downtrend.
Recent XRP Price Action Breakdown
Failed Breakout at $1.60
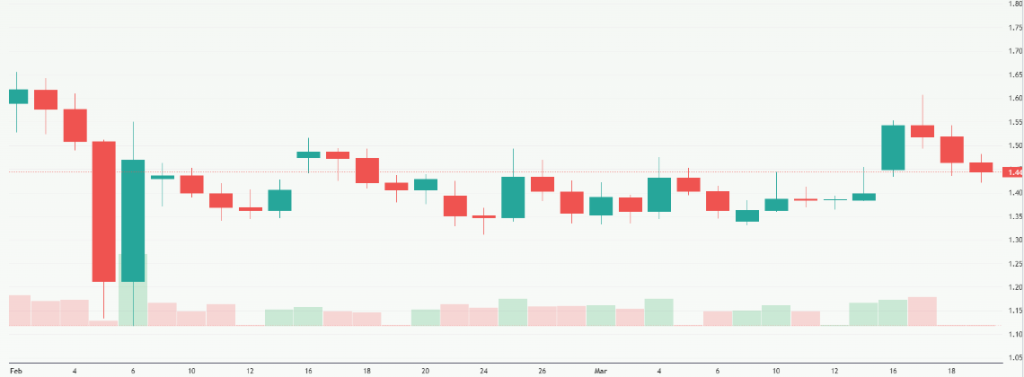
After a strong push toward $1.60, XRP faced fresh selling pressure and failed to sustain gains above that level. On March 17, 2026, the token climbed to around $1.60, its highest since mid‑February, only to be rejected by sellers soon after. The price closed down and extended losses the following day, forming a bearish pin bar pattern on the daily chart.
Key Support & Resistance Levels
This formation is a classic sign that upward momentum is weakening at this resistance zone. Traders now see the $1.60 level as a key battleground; a break above it could reignite bullish interest, but repeated failure may fuel more downside.
What Does the XRP’s Technical Picture Suggest?
Bearish Signals in Play
XRP’s recent price action shows bearish technical setups in the near term. The pin bar rejection at the upper boundary of a weeks‑long consolidation range signals that sellers are active near $1.60. Analysts charting XRP see this as a short‑term swing‑trade signal that could push price back toward lower support between roughly $1.13 and $1.26 if downward pressure persists.
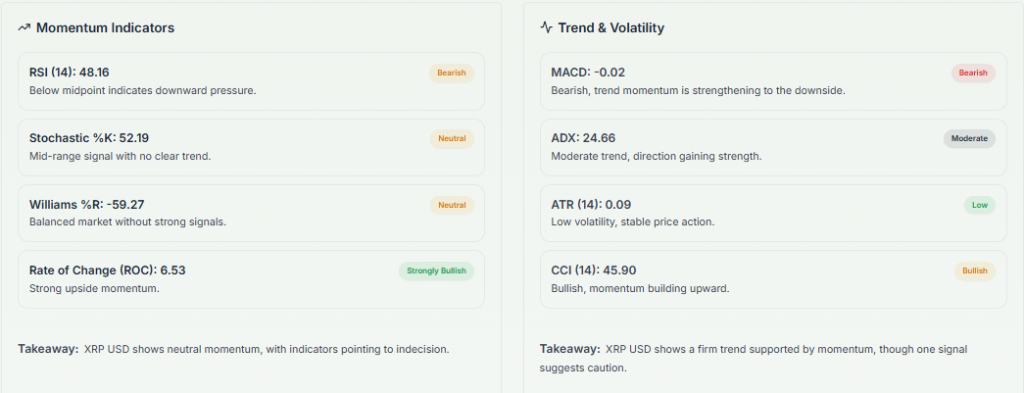
Current technical indicators point to mixed momentum:
- Some neutral momentum metrics like RSI suggest neither extreme buying nor selling.
- Trend strength measures (such as ADX) show meaningful directional conviction, mainly on the downside.
- Price recovery attempts above $1.50 have lacked conviction, keeping the broader trend unclear.
In simple terms, technicals suggest range‑bound behavior with a bias toward sellers unless XRP can consistently close above key resistance. Patterns do not yet confirm a strong breakout, and caution persists among traders.
What are Key Support & Resistance Levels Right Now?
Understanding where XRP might move next means knowing the levels that matter most to traders:
Key Resistance
- $1.60 to $1.65: Critical upper boundary where recent rallies failed.
- Above $1.65: The next challenge would be testing new highs beyond this range.
Major Support
- $1.30 to $1.25: Offers the first meaningful base of demand.
- Below $1.20: Bears could gain momentum if this level breaks.
Reddit‑based crowd analysis also highlights the $1.38 and broader $1.50-$1.65 zones as major overhead hurdles. On the downside, defenders are watching support between $1.30 and $1.24, with further weakness potentially pushing toward lower boundaries if bearish bias continues.
How Is Broader Market Context Affecting XRP?
XRP’s price does not exist in isolation. Recent moves in Bitcoin and major markets have influenced sentiment:
- Crypto markets dipped after the Federal Reserve kept interest rates unchanged on March 18, 2026, which triggered short‑term risk‑off trading. Bitcoin, Ethereum, and XRP all declined on that day, reflecting wider pressure across digital assets.
- At times, geopolitical and macro sentiment have even sparked short rallies when broader markets sought alternative hedges. For example, rising conflict tensions lifted several crypto prices briefly.
These shifts show that macro forces, rates, inflation data, and risk appetite still have significant sway over XRP price action. Traders monitoring XRP should watch Bitcoin’s trend and key macro events, as these can quickly shift broader sentiment.
XRP Price: What are Analyst Views & Forecasts Saying?
Market sentiment on XRP is mixed but cautious right now. Some technical commentators and AI‑assisted chart tools note that bearish momentum could keep prices range‑bound or press lower until a clear breakout occurs. Other analysts point to intermediate support levels as cushions that could limit downside risks, especially if trading volume stabilizes or demand increases.
Longer‑term bullish projections still exist, with some forecasts suggesting that if XRP can absorb selling pressure and break resistance decisively, it could re‑test higher price levels beyond the current range. Yet in the short term, most technical setups favor consolidation or slight declines until buyers show strength above resistance.
Conclusion
XRP’s repeated rejection at the $1.60 resistance level highlights persistent bearish pressure in the short term. Technical setups point to range‑bound trading unless buyers can take control above this key zone. Macro events and broader crypto trends are adding complexity to price action. Traders should watch support near $1.30 and resistance at $1.65 as decisive levels for the next phase.
Frequently Asked Questions (FAQs)
XRP reached $1.60 on March 17, 2026, but sellers stepped in, pushing the price down and preventing a sustained breakout above resistance.
After the rejection at $1.60 and current selling pressure, XRP could dip again, though key support levels may limit deeper losses.
Traders should watch support near $1.40 and resistance near $1.60 to gauge whether XRP moves up or drifts lower.
Disclaimer:
The content shared by Meyka AI PTY LTD is solely for research and informational purposes. Meyka is not a financial advisory service, and the information provided should not be considered investment or trading advice.
What brings you to Meyka?
Pick what interests you most and we will get you started.
I'm here to read news
Find more articles like this one
I'm here to research stocks
Ask our AI about any stock
I'm here to track my Portfolio
Get daily updates and alerts (coming March 2026)