


Did you know not all trends are strong? Some trends are powerful, but others are weak and full of fake moves. That’s why traders use something called the ADX indicator.
ADX stands for Average Directional Index. It helps us measure trend strength. It doesn’t tell us if prices will go up or down. Instead, it tells us how strong the trend is.
If we want to trade trends, knowing strength is super important. A strong trend gives us better trades. A weak trend can waste our time and money.
The ADX indicator is a true trend strength indicator. We will also show you how to use it like a pro.
What is the ADX Indicator?
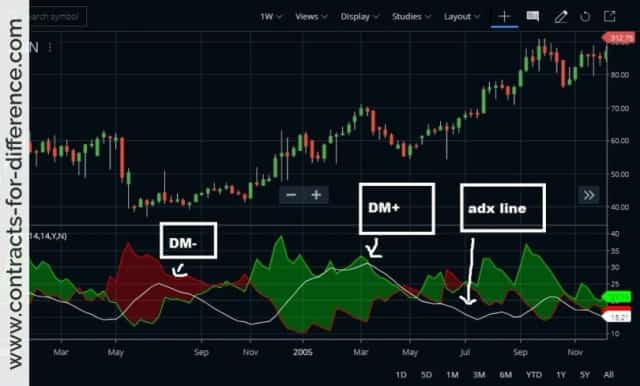
The Average Directional Index (ADX) is a technical analysis tool that helps us measure the strength of a market trend. It was developed by J. Welles Wilder Jr. in 1978, and it is a part of the Directional Movement System, which also includes the Positive Directional Indicator (+DI) and Negative Directional Indicator (-DI).
The ADX specifically measures its strength, and +DI and -DI indicate the direction of the trend. It’s important to note that the ADX does not show whether the trend is upward or downward; instead, it quantifies how strong the current trend is, regardless of its direction.
When we check the ADX, we see if the market has a strong trend or not. Sometimes the market moves sideways with no clear trend. ADX helps us know the difference. This is important when we decide to trade.
Why is the ADX Indicator a Trend Strength Indicator?
First, understand the difference between trend direction and trend strength because it is vital in trading. Trend direction tells us where the market is heading, up or down. Trend strength, on the other hand, indicates how powerful that movement is. The ADX indicator helps traders assess the strength of a market trend before entering trades.
The ADX provides readings that help us interpret trend strength:
- Below 20: Weak or no trend.
- 20-40: Moderate trend.
- Above 40: Strong trend.
Strong trends offer better trading opportunities and the potential for higher profits. Weak trends or sideways markets can lead to false signals and increased risk. Traders can filter out weak or sideways markets through this indicator and focus only on strong trends that align with their trading strategies.
How to Calculate the ADX Indicator
Calculating the ADX involves several steps:
- Determine +DM and -DM: Compare the differences between consecutive highs and lows to find the positive and negative directional movements.
- Calculate +DI and -DI: Divide the smoothed +DM and -DM by the Average True Range (ATR), then multiply by 100.
- Compute the Directional Movement Index (DX): Find the absolute difference between +DI and -DI, divide by their sum, and multiply by 100.
- Calculate the ADX: Smooth the DX values over a set period (typically 14 periods) to get the ADX.
Most trading charts show the ADX for us. But knowing how ADX is made helps a lot. It shows us that ADX comes from real price moves. This makes it a powerful tool for technical analysis.
How to Use the ADX Indicator in Trading
Identifying Strong Trends
When the ADX crosses above 20, it signals that a trend is forming. An ADX reading above 40 confirms a strong trend. This information helps traders decide to follow the trend or stay out of the market.
Combining ADX with Other Indicators
Traders often combine the ADX with other technical tools to enhance trading accuracy:
- ADX + Moving Averages: Moving averages help determine the trend direction, while the ADX measures its strength. Together, they provide a clearer picture of market conditions.
- ADX + RSI: The Relative Strength Index (RSI) identifies overbought or oversold conditions. Using it alongside the ADX helps avoid false signals in strong trends.
- ADX + Candlestick Patterns: Candlestick patterns indicate potential market reversals or continuations. Combining them with a strong ADX reading can confirm entry points in strong trends.
ADX in Different Market Conditions
The ADX helps traders adjust their strategies based on market strength:
- Strong Trend: When the ADX indicates a strong trend, traders might employ trend-following strategies, such as buying during uptrends or selling during downtrends.
- Weak Trend: If the ADX shows a weak trend, range-bound or sideways strategies may be more appropriate, as the market lacks a clear direction.
When we use the ADX in different markets, we can change our plans to fit the trend’s strength. This helps us trade smarter and gives us a better chance to win.
Advantages and Limitations of the ADX Indicator
- The ADX works across various timeframes, including intraday, swing, and long-term trading.
- It provides clear indications of trend strength, helping traders make informed decisions.
- As a lagging indicator, the ADX is based on historical data, which may delay signals.
- The ADX measures trend strength but doesn’t indicate the trend’s direction; traders need to pair.
Final Thoughts
The ADX indicator is a powerful tool for checking trend strength. It helps us avoid weak trends and focus on strong ones. Strong trends give better trading chances. Weak trends bring false signals. We can combine ADX with other tools fro smart trading. This way, we get a complete picture.
Frequently Asked Questions (FAQs)
It tells us if a trend is strong or weak. It does not show trend direction, only strength.
A good ADX is above 20. It means the trend is strong enough to trade. Above 40 is even stronger.
The secret is simple. Strong trends give better trades. ADX helps us find strong trends and avoid weak or choppy markets.
We read ADX by looking at its value. Below 20 means weak trend. Above 20 means trend forming. Above 40 means strong trend.
Disclaimer
Trading involves risks. While artificial intelligence for stock trading can improve decision-making, it’s not foolproof. Always do your research and consult experts before making financial decisions. AI is a tool to assist you, not a guarantee of success.
What brings you to Meyka?
Pick what interests you most and we will get you started.
I'm here to read news
Find more articles like this one
I'm here to research stocks
Ask Meyka Analyst about any stock
I'm here to track my Portfolio
Get daily updates and alerts (coming March 2026)