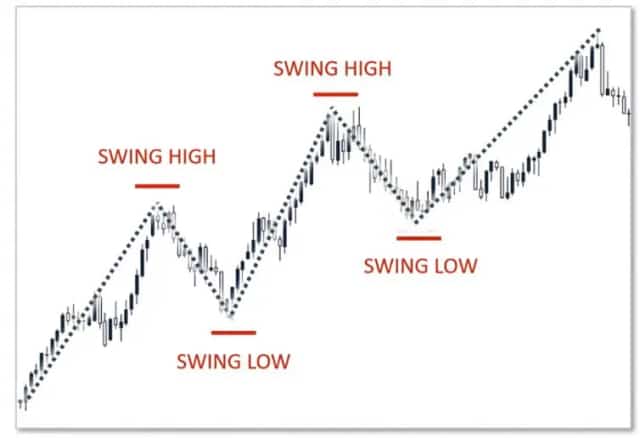
Did you know that most stock prices don’t move in a straight line? Instead, they rise and fall in waves. This is called swing trading. It helps traders profit from these short-term ups and downs.
Unlike day trading, where trades last only a few hours, swing trading holds positions for a few days or weeks. The goal is simple, buy when prices are low and sell when they go higher. It works in stocks, crypto, forex, and more.
We don’t need to stare at screens all day. We can catch market swings and make steady gains with the right strategy. Let’s explore how swing trading works and the best ways to use it.
Key Indicators Used in Swing Trading
Swing traders use various technical indicators:
- Moving Averages (MA): These help us identify the overall direction of a stock’s price by smoothing out price data over a specific period. For example, a 50-day moving average shows the average closing price over the last 50 days.
- Relative Strength Index (RSI): This momentum oscillator measures the speed and change of price movements. It ranges from 0 to 100 and helps us identify overbought or oversold conditions. An RSI above 70 may indicate that a stock is overbought, while an RSI below 30 may suggest it is oversold.
- Bollinger Bands: These consist of a middle band (a simple moving average) and two outer bands representing standard deviations from the middle band. They help us understand a stock’s volatility and potential price levels. When prices move closer to the upper band, the stock may be overbought; near the lower band, it may be oversold.
- Fibonacci Retracement: This tool uses horizontal lines to indicate areas of support or resistance at key Fibonacci levels before the price continues in its original direction. Traders use these levels to predict potential reversal points.
Popular Swing Trading Strategies
Here are some common strategies we might use:
- Trend Following: We buy stocks in an uptrend and sell them when the trend shows signs of weakening. Moving averages can help confirm these trends.
- Breakout Trading: We enter a trade when a stock’s price breaks through a key resistance level, expecting the price to continue rising. Confirming this move with increased trading volume is important.
- Reversal Trading: We look for signs that a current trend is about to reverse. Indicators like the RSI and specific candlestick patterns can signal these reversals.
- Moving Average Crossover: We buy when a short-term moving average crosses above a long-term moving average, indicating potential upward momentum. We sell when the short-term moving average crosses below the long-term moving average.
Risk Management in Swing Trading
Managing risk is important in swing trading.
We can do this by:
- Setting Stop-Loss and Take-Profit Orders: These orders automatically close our position at predetermined price levels to limit losses or secure profits.
- Considering the Risk-Reward Ratio and Position Sizing: We assess how much we’re willing to risk compared to the potential reward and adjust the size of our trades accordingly.
- Avoiding Overleveraging: Using too much-borrowed money can amplify losses. It’s important to use borrowed money carefully.
Pros and Cons of Swing Trading
Pros:
- Since we don’t need to monitor the markets constantly, swing trading can be less stressful.
- It allows us to trade without needing to dedicate full-time hours.
- We can capitalize on short-term price movements without committing to long-term investments.
Cons:
- Understanding and interpreting technical indicators is essential.
- Sudden market changes can adversely affect our positions.
- Events outside of trading hours can impact our trades.
Closing
Swing trading offers a way to profit from short-term market movements without the need for constant monitoring. We can use technical indicators and employ effective risk management strategies to increase our chances of success. However, it’s important to recognize the risks involved and continually improve our trading skills. Practicing with a demo account before committing real money can be a valuable step in building confidence and competence.
Frequently Asked Questions (FAQs)
The best swing trading strategies often involve technical analysis, such as moving averages, RSI, and MACD. Combining these indicators can help identify potential entry and exit points.
The 2% rule advises that we should not risk more than 2% of our total trading capital on a single trade. This helps limit potential losses.
The 3-5-7 rule suggests:
1. Risk no more than 3% of capital per trade.
2. Limit total exposure to 5% across all trades.
3. Aim for a 7% profit on winning trades.
This strategy helps manage risk effectively.
Swing trading involves holding a stock for several days to weeks to profit from price swings. For example, buying a stock at $50 and selling at $55 after a week.
Disclaimer
Trading involves significant risk, and it’s possible to lose more than your initial investment. This article is for informational purposes only and does not constitute financial advice. Always conduct your own research or consult with a licensed financial advisor before making trading decisions.
What brings you to Meyka?
Pick what interests you most and we will get you started.
I'm here to read news
Find more articles like this one
I'm here to research stocks
Ask Meyka Analyst about any stock
I'm here to track my Portfolio
Get daily updates and alerts (coming March 2026)