Did you know the Fibonacci sequence is found in nature, art, and even financial markets? This unique pattern of numbers helps traders predict price movements. Fibonacci retracement is a popular tool in technical analysis. It helps us find key levels where prices might pull back before continuing in the same direction.
As we all know, markets don’t move in straight lines. Prices go up and down and create trends and corrections. Fibonacci retracement levels act like checkpoints and show where prices may pause or reverse. Traders use these levels to find buying and selling opportunities.
Let’s discuss in detail, how Fibonacci retracement works, its key levels, and how to use it in trading.
What is Fibonacci Retracement?
The Fibonacci sequence begins with 0 and 1, and each subsequent number is the sum of the previous two: 0, 1, 1, 2, 3, 5, 8, 13, and so on. The ratios derived from this sequence, such as 61.8%, 38.2%, and 23.6%, are significant in various natural phenomena and are also applied in financial markets.
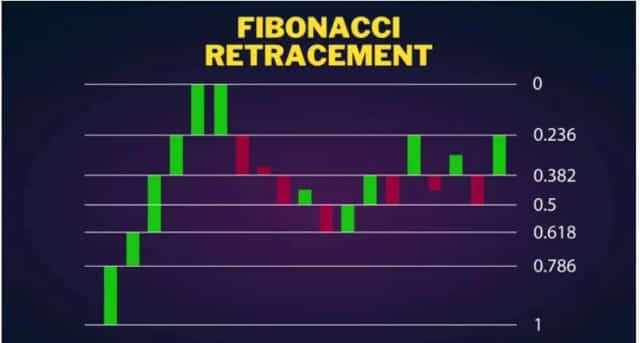
In trading, Fibonacci retracement levels are horizontal lines that indicate where support and resistance are likely to occur. These levels are drawn by identifying two extreme points on a chart, typically a high and a low, and dividing the vertical distance by key Fibonacci ratios. The resulting levels are 23.6%, 38.2%, 50%, 61.8%, and 100%.
Traders use Fibonacci retracement levels to determine potential reversal points by analyzing the price movements between significant highs and lows.
Key Fibonacci Retracement Levels
- 23.6% – Minor Pullback Level This level represents a shallow retracement, indicating a minor correction before the trend continues.
- 38.2% – Moderate Retracement Level A retracement to this level suggests a more significant correction but is still within the bounds of the prevailing trend.
- 50% – Psychological Retracement (Not a True Fibonacci Level) Although not derived from the Fibonacci sequence, the 50% level is commonly used due to the tendency of assets to retrace half of their previous move before reversing.
- 61.8% – Strong Retracement Level This level is considered the golden ratio and is closely watched by traders as a potential reversal point.
- 78.6% – Deep Retracement Level A retracement to this level indicates a deep correction, and traders should exercise caution as it may signal a potential trend reversal.
Traders analyze these levels and identify potential entry and exit points, set stop-loss orders, and determine profit targets.
How to Use It in Trading
- First, identify the swing high and swing low points on a price chart to apply Fibonacci retracement. A swing high is a peak reached by the price before a decline, and a swing low is a trough reached before a rise.
- Once the swing high and swing low are identified, draw the Fibonacci retracement tool from the low to the high in an uptrend, or from the high to the low in a downtrend. The tool will automatically plot the key retracement levels on the chart.
- The plotted levels indicate potential support and resistance areas where the price might pause or reverse. Traders monitor these levels to anticipate market reactions and plan their trades accordingly.
Combination of Fibonacci Retracement & Other Indicators
- Moving Averages – Confirming Retracement Levels Moving averages can help confirm the significance of Fibonacci levels. If a Fibonacci level aligns with a moving average, it strengthens the potential support or resistance at that level.
- RSI (Relative Strength Index) – Identifying Overbought and Oversold Conditions The RSI measures the speed and change of price movements. When the RSI indicates overbought or oversold conditions near a Fibonacci level, it can signal a potential reversal.
- MACD (Moving Average Convergence Divergence) – Trend Confirmation The MACD helps identify changes in the strength, direction, momentum, and duration of a trend. Aligning MACD signals with Fibonacci levels can provide more reliable trading opportunities.
Combining Fibonacci retracement levels with traditional support and resistance analysis enhances the accuracy of identifying key price levels.
Common Mistakes When Using Fibonacci Retracement
It’s essential to be aware of common mistakes to enhance its effectiveness:
- Selection of incorrect swing high and low points can lead to inaccurate retracement levels. Ensure using the correct extremes of the price movement to draw reliable levels.
- The use of Fibonacci retracement in isolation can be risky. It’s necessary to combine it with other technical indicators or analysis methods to validate potential support or resistance levels.
- Applying Fibonacci retracement without considering the overall market trend or price action can lead to misleading conclusions. Always align your analysis with the broader market context.
Practical Examples of Fibonacci Retracement in Trading
Let’s explore practical examples to understand how Fibonacci retracement is applied in trading:
- Example of an Uptrend Retracement Imagine a stock price rising from $50 to $100. Using Fibonacci retracement, we identify potential support levels at:
- 23.6% Level: $88.20
- 38.2% Level: $80.90
- 50% Level: $75.00
- 61.8% Level: $69.10
- Example of a Downtrend Retracement Consider a cryptocurrency dropping from $200 to $100. Fibonacci retracement levels indicate potential resistance at:
- 23.6% Level: $123.60
- 38.2% Level: $138.20
- 50% Level: $150.00
- 61.8% Level: $161.80
Case Study: Lululemon Athletica Inc. (LULU)
In August 2024, Lululemon’s stock moved sharply after its earnings report. It had been in a downtrend since its December 2023 high. Before earnings, it faced resistance near $272, at the 50-day moving average.
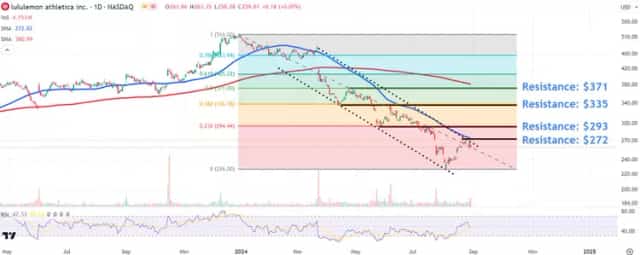
After earnings, the stock jumped. Traders watched the $272 level closely. A breakout could mean a trend reversal. Key resistance levels were $293 (23.6% Fibonacci) and $335 (38.2% Fibonacci).
This case shows how Fibonacci retracements helps traders spot support and resistance. It works best with other indicators like moving averages and trendlines.
Final Words
Fibonacci retracement is a valuable tool in technical analysis. Remember to use Fibonacci retracement in conjunction with other analysis tools and always consider the broader market context.
Frequently Asked Questions (FAQs)
The 61.8% retracement level is often considered significant by traders. It’s derived from the golden ratio, indicating a strong potential support or resistance area.
Fibonacci retracement levels, such as 23.6%, 38.2%, 50%, and 61.8%, indicate possible support or resistance areas where the price might reverse during a trend.
Key Fibonacci extension levels include 100%, 161.8%, 200%, 261.8%, and 423.6%. These levels help traders identify potential price targets beyond the current range.
The 0.618 ratio, or 61.8%, is known as the golden ratio. It’s derived from dividing a number in the Fibonacci sequence by the number immediately following it and represents a key level in technical analysis.
Disclaimer
Trading involves significant risk, and it’s essential to conduct thorough research and consult with a financial advisor before making any trading decisions.
What brings you to Meyka?
Pick what interests you most and we will get you started.
I'm here to read news
Find more articles like this one
I'm here to research stocks
Ask Meyka Analyst about any stock
I'm here to track my Portfolio
Get daily updates and alerts (coming March 2026)