Picture the stock market as a heart monitor, with its lines zigzagging up and down. These movements, known as volatility, show the market’s pulse. We use tools called volatility indicators to understand this better. One key tool is the VIX Index, often called the “fear gauge.” It measures how much change investors expect in the market over the next 30 days. When the VIX is high, it signals that investors anticipate significant market swings; when it’s low, they expect calmer times.
We will discuss volatility indicators and the importance of the Vix index in volatility in detail. So, let’s begin!
What are Volatility Indicators?
Volatility shows how much an asset’s price moves over time. High volatility means big price swings. Low volatility means small changes. Traders and investors watch volatility to measure risk and find chances to profit.
Volatile assets can bring big gains but also big losses. Day traders like high volatility for quick trades. Long-term investors prefer steady assets. Bitcoin, for example, can jump or drop over
20% in a day. Gold, on the other hand, is more stable and moves less.
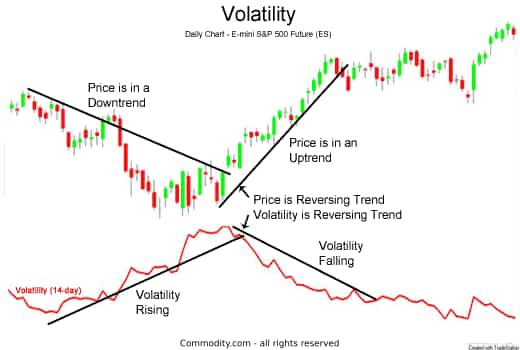
Image Source: Commodity
There are two main ways to measure volatility. Historical volatility looks at past price swings to guess future moves. Implied volatility predicts future price changes based on market expectations. These help traders make smart choices.
Common Volatility Indicators
Several indicators help track volatility. Here we are discussing some common indicators below:
- Bollinger Bands:
Uses a 20-period SMA and standard deviations to create bands around price. Breakouts and contractions signal potential price movements. Expanding bands indicate increased volatility, providing entry or exit opportunities. - Keltner Channel:
Combines a 20-period EMA and ATR to form price bands. It helps identify trends and volatility. When the price touches the lower band, it signals potential selling, and the upper band indicates buying. - Donchian Channel:
Defines support and resistance levels by tracking the high and low of previous periods. It helps identify breakout points, with upper and lower bands serving as key price action zones. - Average True Range (ATR):
Measures market volatility by calculating the high-low range of a stock over a specified period. ATR determines stop-loss levels and assesses potential market movements based on volatility.
What is the VIX Index?
The VIX, or Volatility Index, measures expected price swings in the S&P 500 over the next 30 days. The “fear index” reflects how uncertain investors feel about the market’s near future. Reflects market fear or greed, derived from options pricing. A high VIX signals increased market volatility and fear, while a low VIX suggests calm markets, influencing options trading strategies.
How Traders Use the VIX for Market Insights
Traders watch the VIX to gauge market sentiment. A rising VIX suggests increased fear and potential market drops, while a falling VIX indicates confidence and possible market gains. Some traders use the VIX to time their trades, buying when the VIX is high (expecting prices to rise) and selling when it’s low (anticipating a decline).
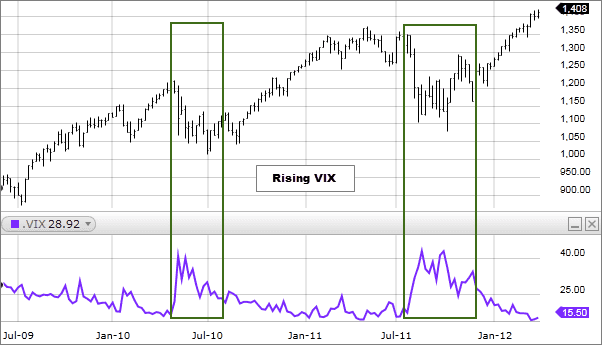
Image Source: Fidelity
Risk tolerance matters when choosing assets. High-risk traders go for volatile assets like altcoins and NFTs. Conservative investors pick stable ones. Many traders use diversification to mix both and reduce risk.
VIX in Different Market Conditions
In calm markets, the VIX usually stays low which reflects investor confidence. During turbulent times, like economic crises or major geopolitical events, the VIX spikes as uncertainty grows. For example, in late 2024, concerns over tech investments in AI led to a significant market drop, which ultimately caused the VIX to surge.
Market timing is key. Traders use ai stock forecasting tools to predict price moves. High volatility is good for short-term trades. Long-term investors often wait for stable markets or use dollar-cost averaging to lower risk.
Limitations of the VIX and Volatility Indicators
- The VIX is a useful tool, but it’s not perfect. It doesn’t predict the direction of market moves, only the expected volatility.
- Also, the VIX is based on options data, which can be influenced by factors unrelated to actual market sentiment.
- Relying solely on the VIX without considering other indicators can lead to misleading conclusions.
Remember, it’s essential to use it alongside other analyses with AI trading tools for a complete market view.
Conclusion
Volatility is a key part of the market. It shows us when prices may swing wildly or stay steady.
But no single indicator gives the full picture. The VIX doesn’t predict market direction, only how much prices might move. That’s why we should use other volatility indicators like Bollinger Bands, ATR, and Keltner Channels. Keep learning, stay patient, and use the right strategies to navigate market ups and downs. Good luck!
Frequently Asked Questions (FAQs)
Volatility indicators measure how much and how quickly asset prices change. It helps traders assess market risk and potential price movements.
The VIX gauges expected market volatility which reflects investor sentiment and potential market risk.
Volatility refers to the rate at which asset prices increase or decrease. High volatility indicates larger price swings, affecting investment risk and opportunity.
The VIX measures the expected 30-day volatility of the S&P 500 Index, derived from options prices, and serves as a market sentiment indicator.
What brings you to Meyka?
Pick what interests you most and we will get you started.
I'm here to read news
Find more articles like this one
I'm here to research stocks
Ask Meyka Analyst about any stock
I'm here to track my Portfolio
Get daily updates and alerts (coming March 2026)