


Trent’s stock has been on every investor’s radar in early 2026. The share price dipped sharply after its Q3 FY26 earnings showed slower growth than expected, even though profit and revenue still rose year‑on‑year. Today’s price action now shows crucial technical levels gaining attention, with support forming around ₹3,700 and resistance near ₹4,500.
Traders and long‑term holders are debating whether this move marks a temporary pullback or the start of a deeper correction. With macroeconomic headwinds and shifting consumption patterns in the retail sector, many are asking: Is this an opportunistic buy zone or a warning sign? Keep reading to understand what these levels mean for your investment strategy.
Trent Stock Price: Latest Market Context & Quarterly Results
Trent Ltd, a Tata Group‑backed fashion and lifestyle retailer, recently released its Q3 FY26 (December quarter) financial results, driving renewed focus on its stock performance. The company reported a 3% increase in consolidated net profit to ₹513 crore for the quarter, compared with ₹497 crore a year earlier. Revenue jumped about 15% to ₹5,345 crore, signalling continued growth amid pressures on margins and the broader economy.
Despite year‑on‑year gains, market reaction was mixed because growth was slower than some broker expectations and sequential momentum was flat. This dynamic has reinforced the importance of watching key support at ₹3,700 and resistance near ₹4,500 on technical charts.
What are the Latest Earnings and Growth Trends?
In the December 2025 quarter, Trent’s performance showed expansion in revenue but moderated profit growth. The 15% revenue rise reflects solid consumer demand, particularly for its mass‑market value fashion brand Zudio and established Westside format.
However, investors scrutinised the pace of same‑store sales and execution quality. Market participants also noted flat sequential growth, which dampened sentiment after the results. Broader trends in discretionary consumer spending in India’s retail sector continue to influence outlooks.
These earnings dynamics matter because they affect both fundamental valuation and technical price patterns, especially when traders and analysts set their expectations for future quarters.
Technical Analysis of Trent Ltd.: Support and Resistance Levels
Where Is the Key Support Level for Trent Stock?
Technical analysts agree that around ₹3,700 is a critical support zone for TRENT shares. This level has acted as a recent pivot point where buyers have stepped in after declines. Broader market watchers have highlighted this zone as a make‑or‑break support, with weakness below this potentially triggering further downside pressure.
This support reflects psychological and statistical significance from past price action and moving average confluences. Falling below it could signal stronger bearish continuation on charts.
What About Resistance Near ₹4,500?
On the upside, ₹4,500 is widely cited as a near‑term resistance region. This has been a ceiling for recent recovery attempts. Traders see this level as a battleground: a break above could signal bullish momentum, while repeated rejection reinforces sideways or corrective price action.
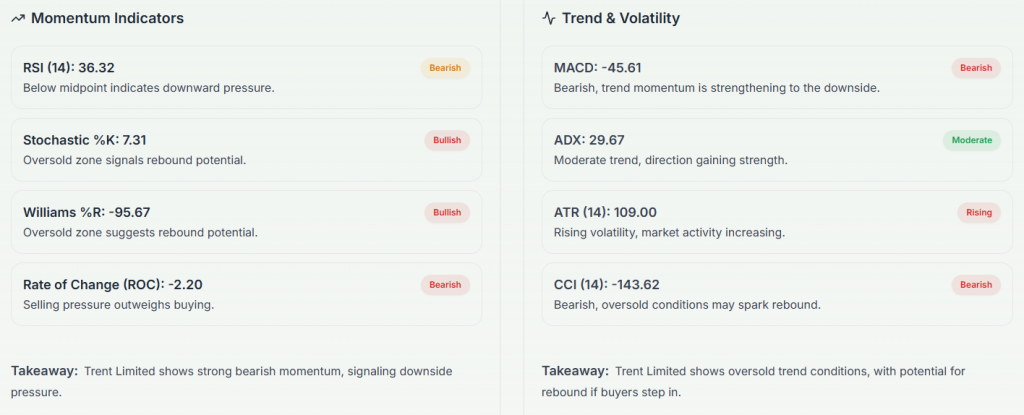
Technical tools like RSI and MACD have also fluctuated, hinting at mixed momentum. Some vendors and charting platforms show oversold conditions pointing to short rebounds, while others suggest the trend still favours sellers until a clear breakout occurs.
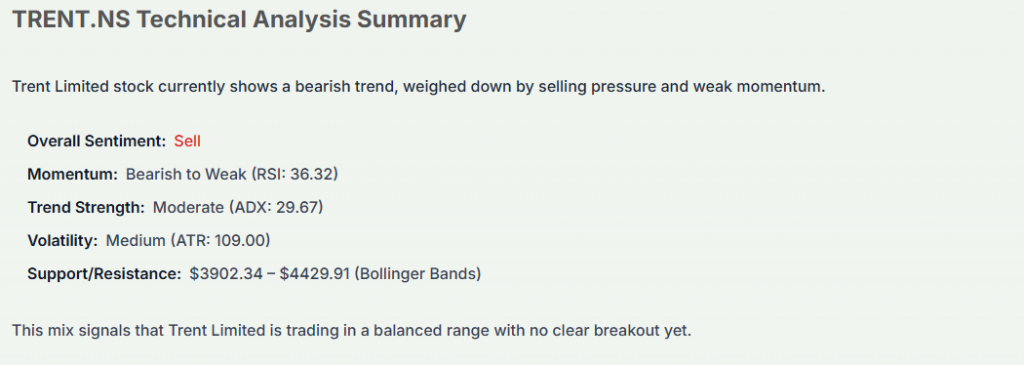
What Meyka Says: Trent Stock Details and Forecast
According to Meyka.com, TRENT.NS shows a bearish to neutral technical makeup in the short term. The platform’s technical summary highlights weakening trend signals and elevated selling pressure, though oversold indicators like money flow may open space for short rebounds.
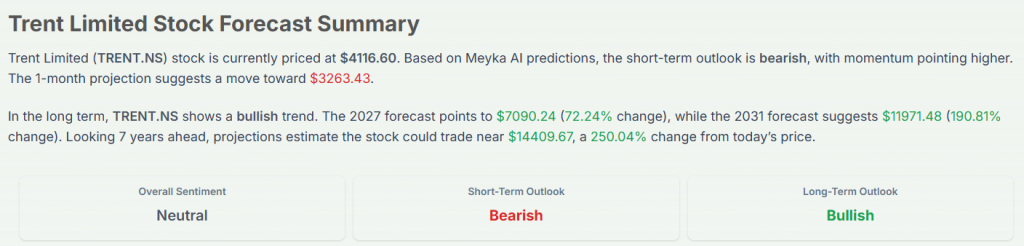
Meyka’s forecast model presents a mix:
- Short‑term: Potential for downside pressures in the next month.
- Long‑term (2026 & beyond): The model anticipates potential upside, showing a yearly projected increase of roughly 44% by end‑of‑2026 and broader gains over multiple years under the long‑term horizon.
This neutral‑to‑bullish long‑term view highlights retail growth potential but warns near‑term volatility may persist.
Trent Stock Forecast: Analyst Opinions & Trends
Market analysts remain divided:
- Sharekhan maintained a buy view with a target nearing ₹6,781, citing long‑term growth from expanding store footprints and brand strength.
- Other brokerages have trimmed expectations, signalling slower same‑store sales and cost pressures. Some emphasise that Trent’s valuation multiples are still high relative to earnings, which could limit near‑term upside until momentum stabilises.
In many commentary threads and trader discussions online, investors point out that the correction reflects an expectation reset rather than a collapse in underlying demand. Improvement in same‑store sales and margin trends is often cited as key for sentiment recovery.
Trent Stock Outlook: Expert Analyst Insights
Is Trent Still Growing Fundamentally?
Yes. Revenue and profit grew year‑on‑year in the latest quarter, and expansion in formats like Zudio and Westside continues to drive top line growth. These formats help Trent reach both value‑oriented and premium consumers.
Should Traders Worry About the Current Downtrend?
Short‑term traders should be cautious. Technical signals show mixed momentum, and key moving averages still influence price direction. A sustained move above resistance or a decisive break below support will help clarify trend bias.
Can Long‑Term Investors Consider Trent a Buy?
Given the long‑term growth forecast and brand strength, many analysts still recommend accumulation on dips for investors with a long horizon. However, high valuations and trend volatility require patience and disciplined entry points.
Strategic Takeaways for Investors
- Watch ₹3,700 as a major support, a breach may signal deeper correction.
- A sustained rally above ₹4,500 could open room for trend recovery.
- Long‑term growth remains anchored in store expansion and market share gains, particularly through value fashion.
- Valuation levels are rich; therefore, risk management and careful position sizing are advisable.
Final Words
Trent’s stock outlook stands at a crossroads between near‑term technical pressure and long‑term retail growth potential. Key levels like ₹3,700 support and ₹4,500 resistance are shaping investor strategy right now. While recent earnings show resilient revenue growth, slower momentum and valuation concerns have injected volatility into the share price.
Together with insights from AI‑driven tools and high‑authority forecasts, this blend of data suggests cautious optimism for long‑term holders, and disciplined tactical trading for short‑term participants. A clear trend break up or down may ultimately define Trent’s next major move in 2026.
Frequently Asked Questions (FAQs)
Trent stock has a key support around ₹3,700 where buyers may step in. Above, resistance is near ₹4,500 where price often slows or reverses before moving higher.
Analysts are mixed on TRENT.NS. Some see long‑term growth, while others warn of slow sales and price pressure. Neither clear buy nor sell trend is firmly confirmed yet.
Yes. In Q3 FY26, Trent’s revenue grew but below expectations. This made shares fall in early January 2026 as investors adjusted to slower growth.
Disclaimer:
The content shared by Meyka AI PTY LTD is solely for research and informational purposes. Meyka is not a financial advisory service, and the information provided should not be considered investment or trading advice.
What brings you to Meyka?
Pick what interests you most and we will get you started.
I'm here to read news
Find more articles like this one
I'm here to research stocks
Ask our AI about any stock
I'm here to track my Portfolio
Get daily updates and alerts (coming March 2026)