More people are investing in the stock market today than ever before. In fact, over 60% of Americans now own stocks, either directly or through retirement accounts. The need for better tools is growing fast with so many investors. That’s where stock dashboard work. They help us track prices, news, charts, and trends, all in one place. A good dashboard saves us time and stress.
Some dashboards are simple but limited. Others are powerful but hard to use.
Advertisement
Let’s have a look at the top 3 stock dashboards people are using in 2025. Then we’ll show you why Meyka AI’s dashboard is not just smart but also the best choice for modern investors like us.
What Makes a Good Stock Dashboard?
A good stock dashboard helps us stay on top of the market. It gives us the right tools to make smart choices without wasting time. Here’s what we should look for:
- Real-Time Stock Data and News: Prices and headlines must update instantly.
- Easy-to-Read Interface: We need clear visuals and custom settings.
- Analysis Tools: Both technical (charts, indicators) and fundamental (earnings, ratios).
- Portfolio Tracking and Alerts: So we know when to act.
- AI and Smart Insights: Some dashboards use AI to help us spot trends early.
When these features work together, we feel more confident managing our money.
Top 3 Stock Dashboards in 2025
a. TradingView
TradingView is a popular platform among traders. It’s known for its detailed charts and a large user community.
Pros:
- Dozens of indicators and drawing tools
- Share trading ideas with others
- Works well on phones and laptops
Cons:
- Too advanced for beginners
- Best features are behind a paywall
Ideal for: Visual learners and technical traders
b. Yahoo Finance
Yahoo Finance has been around for a long time. It’s simple and covers the basics.
Pros:
- Free access to financial news
- Good for checking company info
- Easy to use for casual investors
Cons:
- Not many tools for deep analysis
- Feels outdated to some users
Ideal for: Long-term investors and beginners
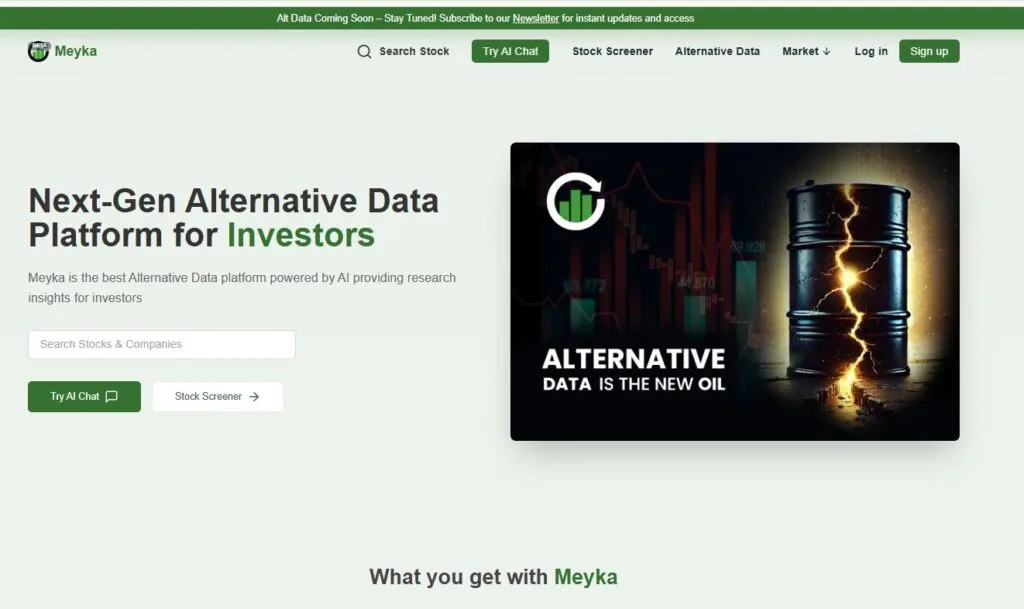
c. Meyka AI
Meyka AI is a rising star in 2025. It blends smart technology with a simple design and yes, it’s completely free for all users.
Pros:
- AI-powered insights and risk analysis
- Smart alerts and predictive signals
- Clean, simple dashboard anyone can use
- Real-time data and earnings previews
- No subscription required, Meyka is 100% free
Ideal for: Smart investors, busy people, and anyone who wants power without the price
Why Meyka AI Is the Best Stock Dashboard
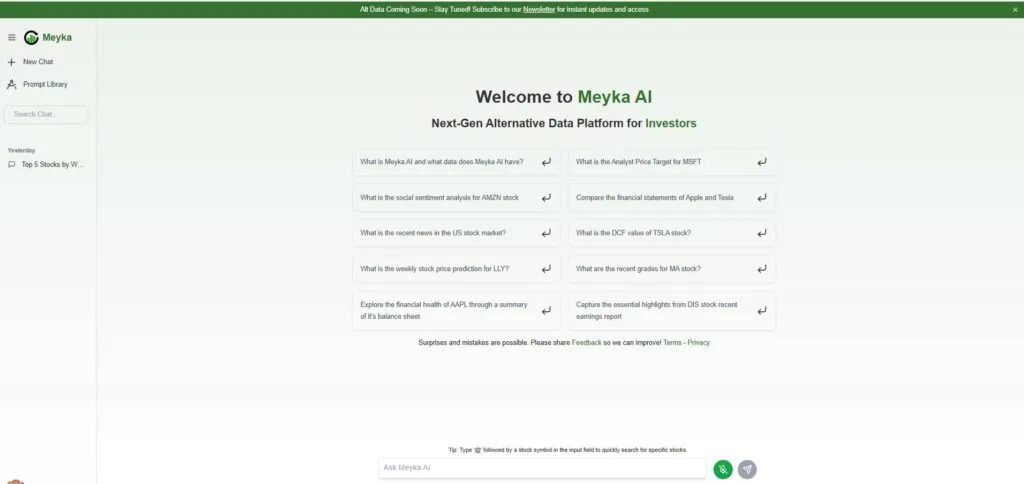
a. AI-Powered Insights
Meyka’s AI looks at trends, patterns, and stock behavior. This helps us make better decisions, even if we’re not experts.
b. Clean & Intuitive Interface
No confusion. No clutter. Just smart tools and charts. We can easily find what we need without clicking around too much.
c. Real-Time Alerts & Notifications
Set price alerts. Get notified when earnings are near. Meyka sends updates instantly, so we don’t miss anything important.
d. Built for Modern Traders
Meyka works for us, we check stocks once a day or trade every hour. It gives us earning summaries, key metrics, and performance snapshots, all in one place.
e. User-Centric & 100% Free
Here’s the best part, Meyka is totally free. No subscriptions. No hidden fees. And the team listens to users and updates the platform based on feedback. That’s rare.
Final Thoughts
Each dashboard has something to offer with a unique feature. TradingView is great for chart lovers. Yahoo Finance is simple and solid. But Meyka AI is the future with smart AI tools, real-time alerts, and a clean layout.
Plus, it’s free for everyone. If we want smart, fast, and easy investing, Meyka is where we start.
Advertisement
Frequently Asked Questions (FAQs)
Meyka is one of the best free AI tools today. It gives live stock data and smart alerts. The dashboard is easy to use. It helps you make smart decisions.
AI tools analyze market trends and data to provide insights. They help investors understand patterns and make predictions, but outcomes are not guaranteed.
A stock dashboard is a tool that displays real-time market data, charts, and news, helping investors track and analyze stock performance efficiently.
Disclaimer:
This content is for informational purposes only and does not constitute financial advice or investment recommendations. Always do your own research before investing.
Advertisement
What brings you to Meyka?
Pick what interests you most and we will get you started.
I'm here to read news
Find more articles like this one
I'm here to research stocks
Ask our AI about any stock
I'm here to track my Portfolio
Get daily updates and alerts (coming March 2026)