


Stock volume is a powerful tool in trading, but many traders overlook it. Do you know that volume can often predict price movements?
When we watch the number of shares traded, we get clues about how strong a price move really is. High or low volume can tell us if a trend is likely to continue or if a reversal is coming.
Let’s explore in detail how stock volume analysis can help us make smarter trading decisions. We can spot opportunities and avoid traps.
What is Stock Volume?
Stock volume refers to the total number of shares traded for a particular stock during a specific period, such as a day. This metric provides insight into the stock’s liquidity and market activity.
High trading volumes often suggest great investor interest and active participation, while low volumes may indicate stagnation or a lack of market interest.
The Importance of Stock Volume in Trading
Volume helps confirm price trends. When a stock’s price changes with high volume, it shows strong support for the move. If the price changes with low volume, it may not be as strong and could be less reliable.
Additionally, volume can signal potential price reversals. For instance, if a stock has been rising steadily but suddenly experiences a sharp increase in volume without significant price gains, it might indicate that the upward trend is losing momentum, potentially leading to a reversal.
Key Volume Patterns to Watch
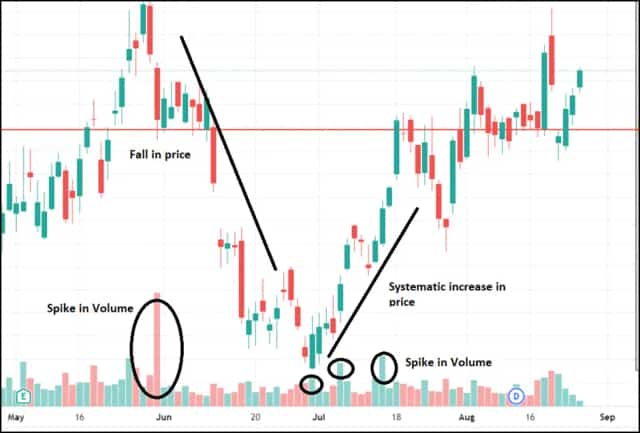
- High Volume with Price Increase: This combination often signifies a strong bullish trend. The increased volume indicates that many investors are buying into the stock, driving the price up.
- High Volume with Price Decrease: When a stock’s price drops on high volume, it typically reflects a strong bearish trend. The substantial selling activity pushes the price down. It confirms the strength of the downward movement.
- Low Volume with Price Increase/Decrease: If a stock’s price rises or falls but the volume remains low, it may suggest a weak trend. Such movements might lack the support needed to sustain the price change. It indicates a potential reversal or consolidation.
- Volume Spikes: Sudden spikes in volume can show potential breakouts or breakdowns. These anomalies often precede significant price movements. This offers traders opportunities to capitalize on upcoming volatility.
How to Use Volume Analysis for Trading Strategies
Integrating volume analysis with other technical indicators can enhance trading strategies:
Observed how volume interacts with moving averages. It can provide insights into trend strength. For example, a price crossing above a moving average on high volume may confirm the start of an uptrend.
The Monitor of volume helps identify high-risk trades. For instance, entering a position when volume is significantly lower than average might expose traders to increased risk due to potential volatility.
Traders use volume to time their entries and exits. A common approach is to enter a trade when the price moves in the desired direction accompanied by above-average volume and to exit when volume begins to wane. It signals a potential reversal.
Tips for Improving Trading Results with Volume Analysis
- Always compare the current volume to historical averages to see if price changes are backed by strong trading activity.
- Avoid making big trading decisions during low-volume periods like holidays or summer when many investors are away. Low volume can cause more price swings and uncertainty.
- Big events, like earnings reports or economic data releases, usually boost trading. Always watch volume these times. It can reveal market response and possible price changes.
Bottom Line
Stock volume tells the real market story. Big volume confirms trends, small volume warns of weak moves. Volume exposes the smart money’s moves. When prices rise on high volume, buyers are strong. When prices fall on high volume, sellers rule. Low volume means traders doubt the moves.
Master volume reading to trade like the pros. It’s your window into what institutions are really doing. This simple tool beats fancy indicators when used right.
Frequently Ask Questions (FAQs)
It’s a risk management strategy: limit single trade risk to 3%, total market exposure to 5%, and aim for a 7% profit-to-loss ratio.
This rule suggests that 90% of traders lose 90% of their money within the first 90 days of trading.
Higher trading volumes indicate liquidity. This makes it easier to buy or sell shares without affecting the price.
This rule advises setting a stop-loss order at 7% below the purchase price to limit potential losses.
Disclaimer:
The information provided is for educational purposes only and does not constitute financial advice. Always consult a professional before making investment decisions.
What brings you to Meyka?
Pick what interests you most and we will get you started.
I'm here to read news
Find more articles like this one
I'm here to research stocks
Ask Meyka Analyst about any stock
I'm here to track my Portfolio
Get daily updates and alerts (coming March 2026)