Stock Market Crash: IRCTC, Tata Motors PV among757 Stocks Hit 52-Week Low as Investors Lose ₹13 Lakh Crore
In a dramatic start to the week, India’s stock market saw one of the steepest sell‑offs in months on March 9, 2026. The BSE Sensex plunged over 2,400 points, and the Nifty 50 slid sharply, erasing more than ₹13 lakh crore in investor wealth in just a few hours of trading. Millions of shares, including heavyweights like IRCTC and Tata Motors Passenger Vehicles, hit 52‑week lows, reflecting deep fear and broad‑based selling across sectors.
This sudden crash wasn’t just about numbers dropping; it spooked traders, shook confidence, and highlighted how global pressures can quickly turn markets turbulent.
Advertisement
Market Overview: Crash by the Numbers
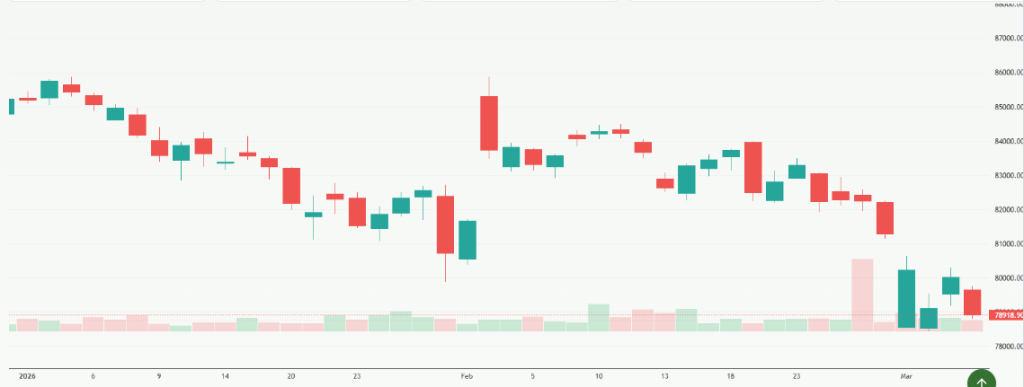
On March 9, 2026, Indian markets faced a severe sell‑off. The BSE Sensex plunged nearly 2,500 points, and the NSE Nifty 50 slid below key support levels, leading to a massive market cap erosion. Within the first hour, investors lost more than ₹13 lakh crore in wealth as markets opened sharply lower amid weak global cues.
The downturn was broad‑based. Most major sectors, including banking, autos, and midcaps, traded deep in the red. Out of thousands of stocks on the BSE, over 750 hit their 52‑week lows as traders shifted to safer assets.
Sensex & Nifty: Key Figures
Sensex reached intraday lows near 76,424, a level unseen since 2024. The Nifty touched about 23,697, reflecting nearly 3 % drops on both indices in early trade.
Foreign institutional investors (FIIs) accelerated selling pressure, adding to domestic nervousness. The India VIX, a gauge of market volatility, spiked sharply, indicating increased fear among traders.
Market breadth showed significant weakness, with more stocks declining than rallying, pointing to a broad sell‑off rather than isolated pressure.
Stocks & Sectors Most Affected
What Stocks Hit 52‑Week Lows and Why?
As markets plunged, 757 stocks hit their lowest levels in the past year. Heavy losses were reported across multiple sectors.
Notable examples include:
- IRCTC: Sharp downside as tourism and discretionary spend shares weakened with risk‑off sentiment.
- Tata Motors PV: Plunged to fresh 52‑week lows, reflecting auto sector stress and broader market weakness.
- HDFC Bank and Asian Paints: Financial and consumer names also lagged.
- Suzlon Energy and Trent: Mid‑ and small‑cap pressures added to the sell‑off.
These declines show how both blue‑chip and cyclicals were affected, raising concerns about market sentiment across industries rather than just individual stock weakness.
Sectoral Weakness Explained
- Banking and financials underperformed as leading lenders, and NBFCs saw heavy selling.
- Automobiles suffered with Tata Motors, Maruti Suzuki, and other auto makers sliding on damp demand expectations.
- Metals & industrials also weakened, echoing risk‑off flows.
Only a few defensive sectors, like select consumer staples and utilities, saw comparatively less pressure.
What Drove the March 2026 Stock Market Crash?
Rising Geopolitical Tensions
One of the primary drivers was the escalating conflict in the Middle East. This unrest pushed crude oil prices sharply higher, directly impacting markets that are heavily dependent on imported energy.
Oil prices touching above $115 per barrel heightened inflation and macroeconomic concerns. Such spikes typically push costs higher for companies and can slow economic growth, stressing equities.
Foreign Selling and Macro Pressures
Significant FII selling added to the downward momentum. When foreign investors withdraw capital, local markets often see broader declines as liquidity tightens.
Meanwhile, India’s rupee weakness, rising bond yields, and global market selloff added to investor anxiety, contributing to the steep drop in benchmark indices.
Analyzing Tata Motors Passenger Vehicles (TMPV.NS)
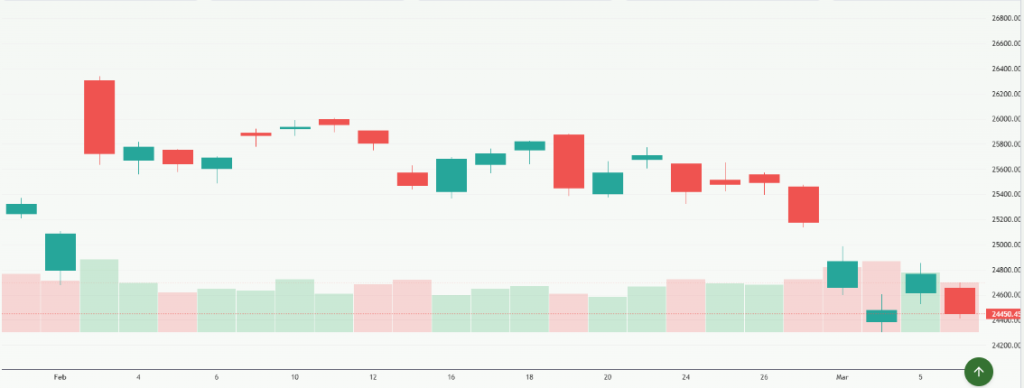
Tata Motors’ passenger vehicle share has been volatile in early 2026 and under significant pressure amid broader auto sector headwinds and mixed earnings data. According to market analysis:
- Volatility remains high, with the stock moving more sharply than many peers due to a high beta value and heavy selling during market downturns.
- Recent swings show the share trading below key technical averages, which signals strong downside momentum.
Meyka’s recent stock analysis shows mixed signals: the platform gives Tata Motors a variable rating, with some metrics supportive, but volatility and near‑term risks still prevailing.
Technical players watch key support and resistance areas, while some analysts suggest demand trends and earnings catalysts could shape future moves once markets stabilize.
What Analysts are Saying on Today’s Stock Market Performance?
Analysts and market strategists point to several reasons for the market’s sell‑off. These include geopolitics, crude oil shock, and global market sentiment shifts. Some believe that if the Middle East conflict de‑escalates, markets could find stability and potentially rebound.
Others highlight that macroeconomic pressures such as currency weakness and rising yields may extend volatility in the short term until clearer global demand pictures emerge.
What Investors are Doing?
In response to the downturn, many investors are taking risk off the table. Defensive plays in staples and utilities are chosen over high‑beta cyclicals. Some long‑term holders are watching for technical support levels to form before re‑entering the market.
Short‑term traders will closely track global news flow and crude price movements as key indicators for market direction in the coming sessions.
Stock Market Outlook: What to Watch Next?
Key indicators to monitor in the near future include:
- Crude oil price trends and geopolitical developments.
- Foreign investment flows and domestic macro data.
- Technical support levels for Sensex and Nifty.
These signals will help traders and investors gauge whether the correction deepens or stabilizes over the short to medium term.
Conclusion
The March 9, 2026, stock market crash was driven by global tensions, oil shocks, and heavy selling pressure that pushed benchmarks sharply lower. With more than ₹13 lakh crore lost and 757 stocks touching 52‑week lows, investor sentiment turned highly cautious. Understanding the macro drivers and stock‑specific factors will help investors stay informed and navigate future market volatility.
Advertisement
Disclaimer:
The content shared by Meyka AI PTY LTD is solely for research and informational purposes. Meyka is not a financial advisory service, and the information provided should not be considered investment or trading advice.
Advertisement
What brings you to Meyka?
Pick what interests you most and we will get you started.
I'm here to read news
Find more articles like this one
I'm here to research stocks
Ask our AI about any stock
I'm here to track my Portfolio
Get daily updates and alerts (coming March 2026)