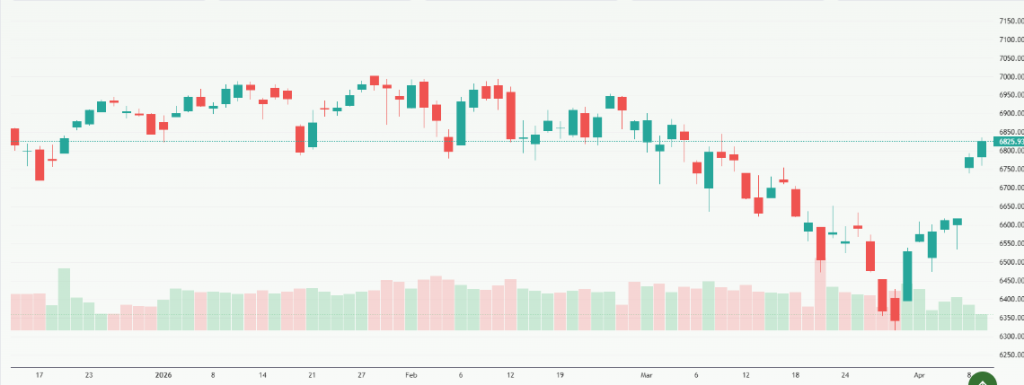
On April 10, 2026, the S&P 500 climbed back above a key technical level that traders closely watch. This move came after days of steady gains in U.S. markets. The index pushed back above its 200-day moving average, a level often seen as a signal of long-term strength. Investors reacted positively as volatility cooled and buying pressure increased across major sectors. Tech stocks and large-cap companies led the recovery.
The index also held firm near the 6,800 zone, which many analysts see as a critical support area. This rebound has shifted short-term sentiment in favor of the bulls. But the big question remains. Is this the start of a stronger uptrend, or just a temporary bounce in a shaky market?
Advertisement
Why Did the S&P 500 Reclaim a Key Technical Level on April 2026?
The S&P 500 moved back above its widely watched 200-day moving average in early April 2026, a level often used by institutional traders to judge long-term trend strength. This shift came after a period of volatility driven by inflation concerns, interest rate uncertainty, and global geopolitical tensions.
The breakout matters because it signals renewed buying interest. Large-cap stocks, especially in technology and communication sectors, led the recovery. Market participation also improved, meaning more stocks joined the upward move instead of just a few leaders.
Analysts from major financial platforms like Reuters and MarketWatch noted that reclaiming long-term moving averages often changes sentiment from defensive to risk-on. This is why investors are now watching whether the index can hold above the 6,800 zone, which has become a critical support level.
What Is Driving the Current S&P 500 Rally?
Is easing volatility the main trigger?
Yes, reduced volatility has been a key driver. After sharp swings in March 2026, markets stabilized as fear-based selling slowed down. Investors started re-entering equities, especially large-cap names.
Other major drivers include:
- Expectations of stable or slightly lower inflation readings in Q2 2026
- Strong corporate earnings guidance from tech-heavy firms
- Improved global sentiment after easing geopolitical pressure in key regions
Energy prices also cooled slightly, which helped reduce inflation fears and supported equity valuations.
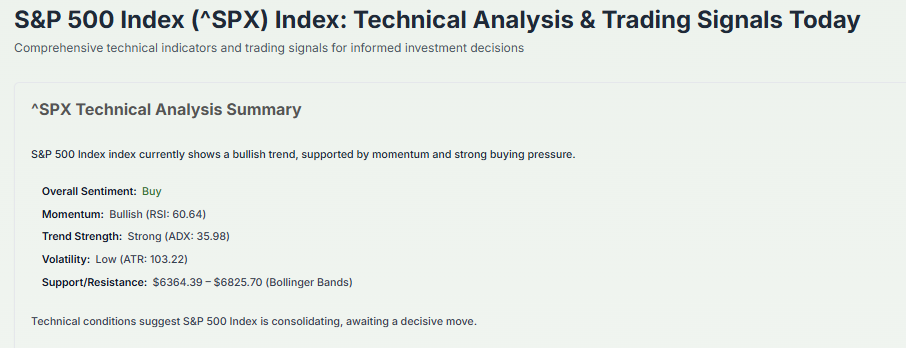
What Does Technical Analysis Say About the S&P 500 Trend?
Is the index now in a bullish phase?
Technically, the S&P 500 has shifted into a short-term bullish structure after breaking above both its 50-day and 200-day moving averages.
Key technical signals include:
- Price holding above 6,800 support zone
- Breakout from a multi-week consolidation range
- Improved market breadth across sectors
Resistance is now seen near the 7,000 psychological level, which traders consider the next major test.
Support levels to watch:
- 6,800: Immediate support after breakout
- 6,600: Strong demand zone from earlier consolidation
If the index holds above these levels, momentum traders may continue to push the market higher in the short term.
What Do Analysts and Market Experts Expect Next?
Will the S&P 500 continue rising in 2026?
Market outlook remains cautiously positive. Analysts from global banks suggest that earnings strength will play a major role in sustaining the rally.
Key expectations include:
- Moderate earnings growth in Q1-Q2 2026
- Continued strength in AI-related stocks
- Possible Federal Reserve rate cuts later in the year if inflation slows
However, experts also warn that the rally may not be smooth. Short-term pullbacks are expected due to profit-taking and macro uncertainty.
According to recent commentary from MarketWatch, historical data shows that once the S&P 500 reclaims major moving averages, it often delivers short-term gains over the next 4-8 weeks, but volatility remains high during confirmation phases.
How are Global Factors Influencing the Market?
Is geopolitics still affecting investor sentiment?
Yes. Global developments continue to influence risk appetite. While tensions in some regions have eased compared to earlier in 2026, uncertainty remains a background risk.
Key global influences include:
- Oil price fluctuations affecting inflation expectations
- Currency movement impacting multinational earnings
- Trade and policy discussions between major economies
Even small geopolitical shocks can quickly shift sentiment in equity markets, especially when valuations are already elevated.
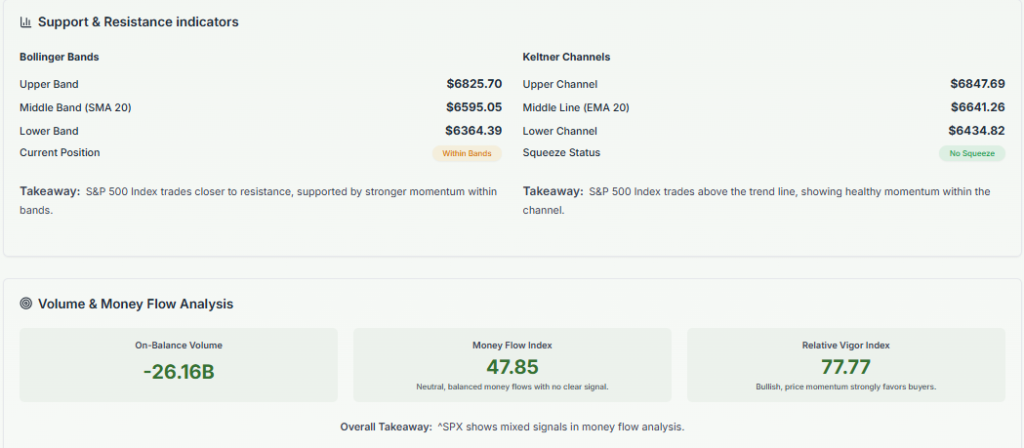
What Does Meyka AI Stock Analysis Tool Indicate for Market Direction?
The Meyka AI stock analysis tool suggests that the S&P 500 is currently in a neutral-to-bullish transition phase. It highlights improving momentum indicators but also flags overbought conditions in select tech stocks.
Key insights from AI-driven analysis:
- Momentum is strengthening but not yet fully stable
- Breadth expansion is positive but still uneven
- Risk of short-term pullbacks remains due to stretched valuations
Overall, AI-based models suggest a “wait-and-confirm” phase rather than a full trend confirmation.
What are the Key Risks That Could Break This Rally?
Could inflation or Fed policy reverse gains?
Yes. Inflation remains the biggest macro risk. If upcoming data in April-May 2026 shows higher-than-expected price pressure, markets may quickly reprice interest rate expectations.
Other risks include:
- Sudden rise in bond yields
- Weak corporate earnings surprises
- Renewed geopolitical instability
- Overbought technical conditions leading to corrections
Investors are closely watching Federal Reserve commentary for signals on future rate decisions.
What Levels Should Traders Watch Next?
The market is now at a decision point. Traders are focusing on a few key levels:
- 7,000: Major resistance and psychological barrier
- 6,800: Immediate support zone
- 6,600: Deeper support if selling pressure returns
A strong breakout above 7,000 could attract fresh momentum buying. On the other hand, failure to hold 6,800 may trigger short-term profit-taking.
Wrap Up
The S&P 500 has regained a crucial technical level, shifting short-term control toward the bulls. Strong momentum, improving market breadth, and easing volatility support the recovery. However, risks like inflation, policy shifts, and global uncertainty remain in play.
The coming weeks will be critical as the index tests whether this breakout can develop into a sustained uptrend or fade into another short-term rally.
Advertisement
Frequently Asked Questions (FAQs)
As of April 10, 2026, S&P 500 rises due to strong tech earnings, easing volatility, and improving investor confidence.
On April 2026, crossing 200-day average signals long-term strength and growing bullish sentiment among institutional investors overall.
In 2026, outlook remains cautious, with possible gains, but inflation, Fed policy, and global risks may cause pullbacks.
Disclaimer:
The content shared by Meyka AI PTY LTD is solely for research and informational purposes. Meyka is not a financial advisory service, and the information provided should not be considered investment or trading advice.
Advertisement
What brings you to Meyka?
Pick what interests you most and we will get you started.
I'm here to read news
Find more articles like this one
I'm here to research stocks
Ask Meyka Analyst about any stock
I'm here to track my Portfolio
Get daily updates and alerts (coming March 2026)