


In trading, we often look for tools to make better decisions. One tool that helps is the Relative Strength Indicator (RSI). It helps traders spot overbought and oversold market conditions.
The RSI was created by J. Welles Wilder in the 1970s. Since then, it has become a popular tool. But why do traders love it? It helps us understand market momentum, predicting when trends might slow down or pick up speed.
Let’s explain how the RSI works, its formula, and how to use it in trading. We’ll also look at its limits and real-life examples.
What is the Relative Strength Index (RSI)?
The Relative Strength Index (RSI) is widely used in technical analysis. It helps traders determine if a stock or asset is overbought or oversold. Created by J. Welles Wilder Jr., the RSI measures how quickly prices are changing. The RSI scale ranges from 0 to 100, reflecting the strength of a security’s price movement.
RSI Formula
To calculate the RSI, we first need to determine the Relative Strength (RS):

Then, the RSI is calculated using the formula:

Where:
- Average Gain: The average of all gains over a specified period (usually 14 periods).
- Average Loss: The average of all losses over the same period.
This calculation helps smooth out price data to identify trends more effectively.
3. Interpreting RSI Values

- Overbought: An RSI above 70 suggests that the asset might be overbought and could be due for a price pullback.
- Oversold: An RSI below 30 indicates that the asset might be oversold and could be due for a price increase.
- Neutral Zone: An RSI between 40 and 60 suggests a neutral market, where neither buyers nor sellers have a clear advantage.
Traders use these levels to make informed decisions about buying or selling assets.
RSI in Trading: Usage and Strategy
Traders watch for RSI values above 70 or below 30 to identify potential reversal points. For instance, if an asset’s RSI moves above 70, it might be a signal to sell, anticipating a price decrease.
Divergence
Divergence occurs when the price of an asset moves in the opposite direction of the RSI. There are two types:
- Bullish Divergence: When the price makes a new low, but the RSI forms a higher low, suggesting a potential upward reversal.
- Bearish Divergence: When the price makes a new high, but the RSI forms a lower high, indicating a potential downward reversal.
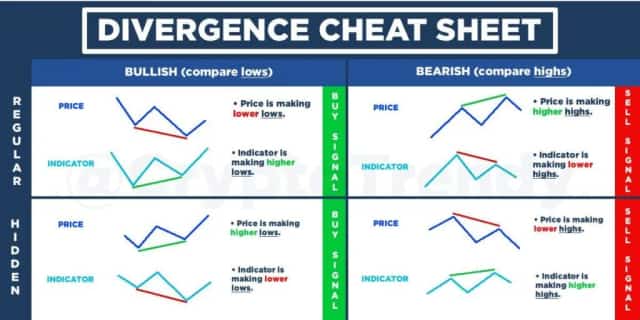
Recognizing these patterns can help traders anticipate future price movements.
Relative Strength Indicator (RSI) can also be used to confirm existing trends. For example, if the RSI is above 50 and rising, it may confirm an uptrend. Conversely, if the RSI is below 50 and falling, it may confirm a downtrend.
Many traders combine RSI with other indicators like Moving Averages or MACD to enhance the reliability of their trading signals. This combination helps confirm trends and potential reversal points.
Limitations of the RSI
While RSI is a valuable tool, it has limitations:
- In strong trending markets, the RSI can remain in overbought or oversold conditions for extended periods, leading to potential false signals.
- RSI is based on past price data, which means it may not always predict future price movements accurately.
- RSI signals should be confirmed with other indicators or chart patterns to increase reliability.
Traders should use RSI as part of a broader strategy, considering other factors and indicators.
Real-World Applications of RSI in Trading
In real-world trading, RSI is widely used across various markets:
- Stock Market: Traders use RSI to identify potential buy or sell opportunities based on overbought or oversold conditions.
- Forex Market: RSI helps forex traders assess market momentum and potential reversal points.
- Cryptocurrency Market: Given the volatility of cryptocurrencies, RSI assists traders in identifying potential entry and exit points.
For example, Tesla’s stock chart recently showed a bullish RSI divergence. This suggested a possible shift in momentum, even though the stock had been in a downtrend. Such divergence has often been a reliable signal, warning bears not to sell and indicating it could be safer to buy during price dips.
Final Words
The Relative Strength Indicator (RSI) is a powerful tool in technical analysis. It helps traders spot overbought or oversold conditions and predict possible reversal points.
However, it’s crucial to understand its limits. Using the RSI alongside other indicators and analysis methods can help traders make better decisions and refine their strategies.
Frequently Asked Questions (FAQs)
The RSI formula is: Average Gain/Average Loss
Where RS is the average gain divided by the average loss over a specified period .
The 60-60-50 RSI strategy involves analyzing RSI across multiple timeframes. A buy signal occurs when the RSI is above 60 on all timeframes, indicating strong bullish momentum .
The RSI 70/30 rule indicates that an RSI above 70 shows overbought conditions, while an RSI below 30 suggests oversold conditions. Traders use these levels to spot possible reversal points in the market.
The RSI is a momentum oscillator that measures the speed and change of price movements. It ranges from 0 to 100, helping traders identify overbought or oversold conditions .
Disclaimer:
This content is for informational purposes only and not financial advice. Always conduct your research.
What brings you to Meyka?
Pick what interests you most and we will get you started.
I'm here to read news
Find more articles like this one
I'm here to research stocks
Ask Meyka Analyst about any stock
I'm here to track my Portfolio
Get daily updates and alerts (coming March 2026)