


Did you know that before prices go up at the store, they often rise for the people who make or
sell the products first? The Producer Price Index, or PPI, keeps track of these early price changes.
The PPI is a tool that tells us how much prices are changing for producers like factories, farms, and mining companies. It’s been measured in the United States for over 120 years, helping everyone from businesses to the government see where the economy is heading.
When we hear about inflation on the news, it usually means prices are going up for everyday items. But inflation begins earlier at the start of the supply chain. This is where the PPI helps us understand more. It shows how much prices are rising before goods ever reach the store shelves.
Let’s explore what the PPI is, how it’s calculated, and why it matters to all of us.
What is the Producer Price Index (PPI)?
The PPI measures price changes from the seller’s side before items reach consumers. Think of it as tracking prices at the very start of the supply chain.
It differs from the CPI (Consumer Price Index), which tracks the prices buyers pay at the store. PPI focuses on wholesale prices of materials, semi-finished goods, and trade services. It covers many sectors: manufacturing, mining, agriculture, utilities, and even transportation.
Why PPI Matters
We care about PPI for several reasons:
- Early inflation warning: It often leads to consumer prices. Rising PPI can predict CPI increases.
- Business planning: Companies use it in contracts to adjust prices if costs change.
- Economic policy: The Fed and economists track it to gauge inflation and set interest rates.
How PPI Is Calculated
Here’s how the process works:
- The BLS gathers about 100,000 monthly price quotes from more than 25,000 producers.
- These are sorted into final demand (goods and services for end users) and intermediate demand (goods used for further production).
- The Laspeyres index formula is used. It compares current prices to a base year (like 1982), weighted by past sales volume:
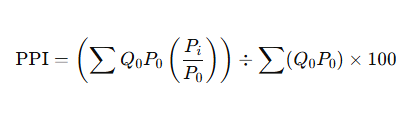
- The BLS adds up the weighted price changes to form the index.
PPI Categories and Indexes
The PPI isn’t just one number. It has many layers:
- Final Demand: Includes goods and services sold to end-users.
- Intermediate Demand: Tracks costs at stages used to make goods, like raw materials or parts.
- You can see the PPI for commodities like steel, energy, or lumber—and also by sector like transportation.
This helps businesses track costs at every stage and lets analysts watch trends in specific fields.
Current Trends (June 2025)
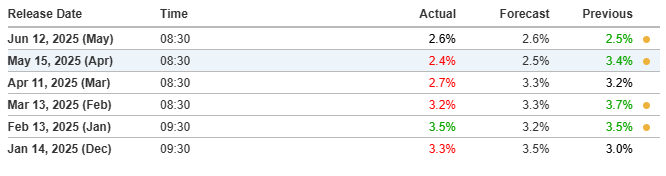
- The PPI for final demand rose 0.1 % in May, after falling in April and March. Over the past year, it’s up 2.6 %.
- The core index excluding food, energy, and trade also rose 0.1 %, making its year-over-year gain 2.7 %.
- Other reports show that U.S. year-over-year PPI stood around 2.6 %, matching analyst forecasts.
- In China, PPI dropped 3.3 % year-over-year in May. That’s its largest fall in nearly two years and signals global deflation pressure.
- The BLS plans to drop about 350 industry indexes from July 2025. These changes will affect less than 1 % of the data and won’t hurt overall tracking.
These numbers help us see the pace of price changes in the economy.
Real-World Examples
- In April, U.S. wholesale prices fell 0.5%, the biggest monthly drop in five years.
- That decline came even as the CPI showed mild inflation. It illustrates how PPI and CPI can diverge in the short term.
- In China, continued PPI decline shows deflation at the factory gate. Lower factory prices affected consumer prices and growth.
How to Read and Interpret PPI
When we review a PPI report:
- Monthly move: A positive reading (+0.1% or +0.2%) shows rising costs at the source. A negative reading signals falling costs or deflation.
- Core vs headline: Core PPI leaves out volatile food, energy, and trade. It shows real underlying trends.
- Overlap with CPI: If PPI rises, it might mean CPI will rise later—unless businesses absorb the cost.
- Context matters: Compare with CPI, global trends, and interest rate signals to understand economic tone.
Limitations of PPI
The PPI has useful insights, but also limits:
- It leaves out imports, which CPI tracks.
- It focuses on first sales, not retail.
- Some indexes are dropped frequently, yet those are minor ones.
- Industry-level swings (like energy or steel) can skew the overall data.
For a balanced view, we always pair PPI with CPI, PCE, and supply-demand data.
Final Words
The PPI captures early inflation trends. It reveals cost pressures in production and trade. For businesses, policymakers, and investors, it’s a vital sign of what costs are doing before consumers feel them.
In the U.S., PPI rose slightly in May, indicating steady but slow inflation at the producer level. Meanwhile, China’s sharp PPI decline highlights global differences in price trends.
We track PPI and can learn how supply chain costs change. We can anticipate inflation and make smarter choices, whether it’s planning business contracts or crafting policy. Together with CPI and PCE, the PPI helps us understand the full picture of inflation and the health of the economy.
Frequently Asked Questions (FAQs)
PPI is calculated by comparing the prices producers get today to prices in a base year. The change is shown as a percentage using a special formula.
A high PPI can mean rising costs for producers. This might lead to inflation. Investors may see it as bearish, but it depends on the full economic picture.
Economists use PPI to predict future inflation. If producer prices rise, consumer prices might rise later. It helps plan interest rates and policy decisions.
A higher PPI is not always good or bad. It may show a growing economy or higher inflation. The effect depends on other factors and how fast prices rise.
PPI = (Price this period ÷ Price in base period) × 100. It shows how prices have changed over time for producers selling goods or services.
PPI means the average change in prices that producers get for goods and services. It tracks prices before things reach stores or customers.
Disclaimer:
This content is for informational purposes only and not financial advice. Always conduct your research.
What brings you to Meyka?
Pick what interests you most and we will get you started.
I'm here to read news
Find more articles like this one
I'm here to research stocks
Ask our AI about any stock
I'm here to track my Portfolio
Get daily updates and alerts (coming March 2026)