


Inverted Yield Curve: A Key Indicator for Investors – Definition & More
Investment requires analysis. We often rely on signals to help predict what might happen next in the economy. One of the most talked-about signals is the yield curve. Normally, this curve slopes upwards, showing that long-term investments pay more than short-term ones. But sometimes, the curve flips upside down. This is called an inverted yield curve. When this happens, it raises eyebrows, especially among investors. Historically, an inverted yield curve has often been a warning sign of an economic recession.
Let’s discuss what an inverted yield curve is, why it matters, and how investors can react to it.
What is a Yield Curve?
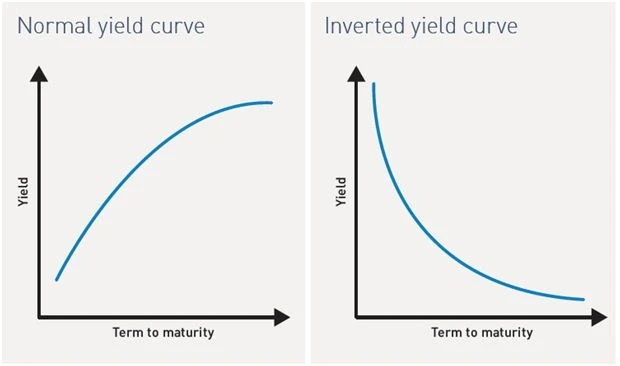
A yield curve is a graph that shows how bond yields (interest rates) vary with different maturity dates. It plots the yields of bonds having the same credit quality but varying maturity periods. Typically, the x-axis represents the time to maturity, while the y-axis shows the annualized yield.
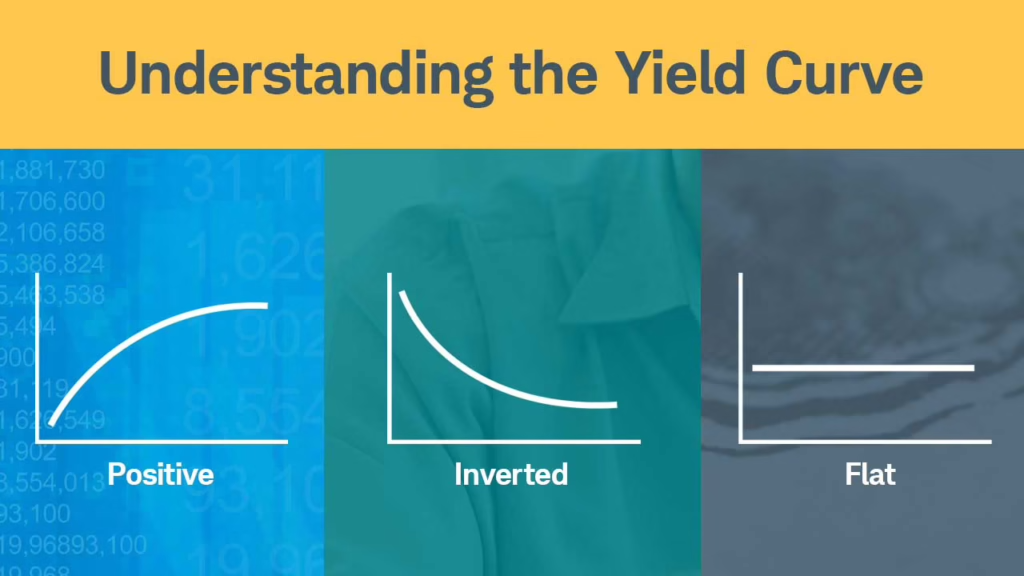
In a normal yield curve, long-term bonds offer higher yields than short-term ones. This upward slope suggests that investors expect a growing economy and anticipate inflation to rise in the future. However, when the yield curve inverts, short-term bonds yield more than long-term bonds. This downward slope often signals that investors expect economic slowdown or recession.
The shape of the yield curve reflects investor expectations about future interest rates and economic conditions. A normal curve indicates optimism about economic growth, while an inverted curve suggests caution and concerns about potential downturns.
What is an Inverted Yield Curve?
An inverted yield curve occurs when short-term debt instruments have higher yields than long-term ones of the same credit risk profile. This situation is unusual because longer-term investments typically carry greater risks and thus offer higher returns.
Several factors can cause a yield curve to invert:
- If investors think a recession is coming, they may expect central banks to lower short-term interest rates. This can lead to more people wanting long-term bonds, which pushes their yields down.
- When the economy is uncertain, investors look for safer investments like long-term government bonds. The higher demand for these bonds can lower their yields, possibly causing the yield curve to invert.
Historically, yield curves have inverted before many U.S. recessions. For example, inversions in the 1980s, 2000, and 2006 preceded economic downturns. However, not every inversion leads to a recession, and the timing can vary.
How an Inverted Yield Curve Signals Economic Recession
The relationship between inverted yield curves and recessions is well-documented. An inverted yield curve has preceded each of the last eight U.S. recessions.
The theory behind this is simple: when investors expect economic problems, they think central banks will lower short-term interest rates to boost growth. This leads to more demand for long-term bonds, which lowers their yields and can cause the yield curve to invert.
During these times, investors tend to be cautious. They move towards safer investments, and the outlook for future economic growth becomes weaker. While an inverted yield curve has often signaled recessions, it’s not always accurate. Other economic signs should also be looked at for a fuller picture.
Implications of an Inverted Yield Curve for Investors
When we, as investors, observe an inverted yield curve, it often prompts us to reassess our portfolios. An inverted curve can have several implications:
Stock Market:
Historically, stock markets have faced challenges during periods following yield curve inversions. The cautious investor sentiment can lead to increased volatility and potential declines in equity markets.
Bonds:
For bond investors, an inverted yield curve can present opportunities. Long-term bonds might offer attractive yields relative to short-term instruments. However, it’s essential to consider the potential for falling interest rates, which can affect bond prices.
Investment Strategies:
In response to an inverted yield curve, some investors might shift towards defensive sectors, dividend-paying stocks, or allocate more to fixed-income securities. Diversification becomes crucial to navigate potential economic headwinds.
How Central Banks Affect Yield Curves
Central banks control short-term interest rates. This changes how yield curves look. The Federal Reserve and other central banks use this power to guide the economy.
When the economy grows too fast, banks raise rates. This stops prices from rising too much. It makes yield curves slope upward normally.
In bad economic times, banks cut rates. This helps businesses and people borrow money easier. These cuts can flatten yield curves. Sometimes they even invert them.
Yield curves give important clues about:
- Future economic health
- Where interest rates may go
- How banks view current conditions
The changes guide investors to make smarter choices. Central bank decisions ripple through all money markets.
Is an Inverted Yield Curve always a Recession Indicator?
An inverted yield curve has often come before recessions, but it doesn’t always mean one will happen. For example, in 2019, the yield curve inverted, but the expected recession didn’t occur.
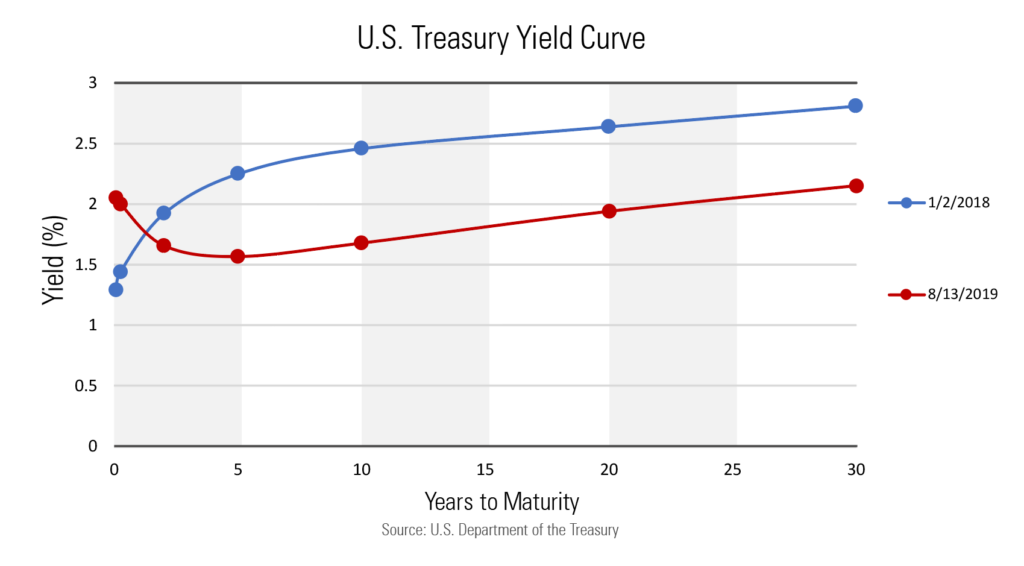
Other factors, like global economic conditions, government policies, and unexpected events (like the COVID-19 pandemic), can also impact the economy. So, while the inverted yield curve is helpful, it should be looked at alongside other economic indicators to get a full picture.
Final Words
The yield curve is a powerful tool for understanding market expectations. An inverted yield curve often signals potential economic challenges, but it’s not always foolproof. As investors, we should consider it alongside other indicators. Staying aware of changes in the economy and central bank policies can help us handle uncertain times and adjust our strategies for long-term success.
Frequently Asked Questions (FAQs)
It suggests investors expect economic slowdown, as short-term bonds offer higher yields than long-term ones.
We monitor it closely, as its inversion has historically preceded economic recessions.
The U.S. yield curve inverted for a record 628 days starting in July 2022.
It reflects investor expectations; an upward slope indicates growth, while inversion hints at potential downturns.
It signifies a return to normalcy, with long-term bonds yielding more than short-term ones, suggesting economic optimism.
A graph where longer-term bonds have higher yields than shorter-term ones, indicating expectations of economic growth.
They make money by purchasing bonds cheap and selling them when prices rise, taking advantage of changing interest rates.
What brings you to Meyka?
Pick what interests you most and we will get you started.
I'm here to read news
Find more articles like this one
I'm here to research stocks
Ask our AI about any stock
I'm here to track my Portfolio
Get daily updates and alerts (coming March 2026)