


Do you know the Ichimoku Cloud was first created in Japan before computers even existed? A journalist named Goichi Hosoda designed it in the 1960s. He wanted a tool that could help traders see the full market picture, trend, momentum, and support or resistance, all at once.
Today, we still use it because it works. The Ichimoku Cloud is not just one line or signal. It’s a full system that tells us if the market is strong, weak, or stuck. Even big investors look at it to decide when to buy or sell.
At first, it may look confusing. There are many lines and colors. But once we understand what each part does, it becomes much easier. Let’s learn what the lines mean, how to use them, and why this tool can give traders an edge. If you’re ready to trade smarter, let’s explore the power of the Ichimoku Cloud together.
What is the Ichimoku Cloud Indicator?
The Ichimoku Cloud is a tool that helps traders see the market’s direction. It was created by a Japanese journalist named Goichi Hosoda in the 1960s. He wanted a way to look at a chart and quickly understand if prices might go up or down.
The full name is Ichimoku Kinko Hyo, which means “one glance equilibrium chart.” This name fits because, with one look, we can see the trend, momentum, and support or resistance levels.
Other tools show only one thing, and the Ichimoku Cloud shows several at once. It gives a full picture of the market to help traders make better decisions.
Components of the Ichimoku Cloud
The Ichimoku Cloud has five main parts. Each part tells us something different about the market.
1. Tenkan-sen (Conversion Line)
- Formula: {(9-period high + 9-period low) ÷ 2}
- Use: Shows the short-term trend.
This line moves quickly with the price. If it’s going up, the short-term trend is up. If it’s going down, the trend is down.
2. Kijun-sen (Base Line)
- Formula: {(26-period high + 26-period low) ÷ 2 }
- Use: Shows the medium-term trend and acts as support or resistance.
This line moves slower than the Tenkan-sen. Traders often watch it to see if the price will bounce off it.
3. Senkou Span A (Leading Span A)
- Formula: {(Tenkan-sen + Kijun-sen) ÷ 2, plotted 26 periods ahead}
- Use: Forms one edge of the cloud.
This line is plotted ahead of the current price. It helps to predict future support or resistance.
4. Senkou Span B (Leading Span B)
- Formula: {(52-period high + 52-period low) ÷ 2, plotted 26 periods ahead}
- Use: Forms the other edge of the cloud.
This line moves even slower and, together with Span A, creates the “cloud.”
5. Chikou Span (Lagging Span)
- Formula: Current closing price plotted 26 periods back
- Use: Helps confirm trends.
If this line is above the price from 26 periods ago, the trend is likely up. If it’s below, the trend might be down.
How to Read the Ichimoku Cloud Indicator
The cloud helps us make better trading choices.
- Price above the cloud: This is a bullish signal. The market is likely going up.
- Price below the cloud: This is a bearish signal. The market might be going down.
- Price inside the cloud: This means uncertainty. The market could go either way.
The cloud’s thickness matters too. A thick cloud means strong support or resistance. A thin cloud means weaker support or resistance.
Crossovers are also important:
- When the Tenkan-sen crosses above the Kijun-sen, it’s a bullish signal.
- When the Tenkan-sen crosses below the Kijun-sen, it’s a bearish signal.
The Chikou Span helps confirm these signals. If it’s above the price from 26 periods ago, it supports a bullish view. If it’s below, it supports a bearish view.
Trading Strategies Using Ichimoku Cloud
Here are some ways traders use the Ichimoku Cloud:
- When the price is above the cloud, and the Tenkan-sen is above the Kijun-sen, traders might look to buy. This setup suggests a strong uptrend.
- If the price moves out of the cloud, it could signal a new trend. Traders watch for the Tenkan-sen crossing the Kijun-sen to confirm this move.
- The cloud itself acts as support or resistance. Traders might place stop-loss orders just below the cloud in an uptrend or above it in a downtrend.
- Some traders use the Ichimoku Cloud with tools like the Relative Strength Index (RSI) or Moving Average Convergence Divergence (MACD) to get more confirmation before making a trade.
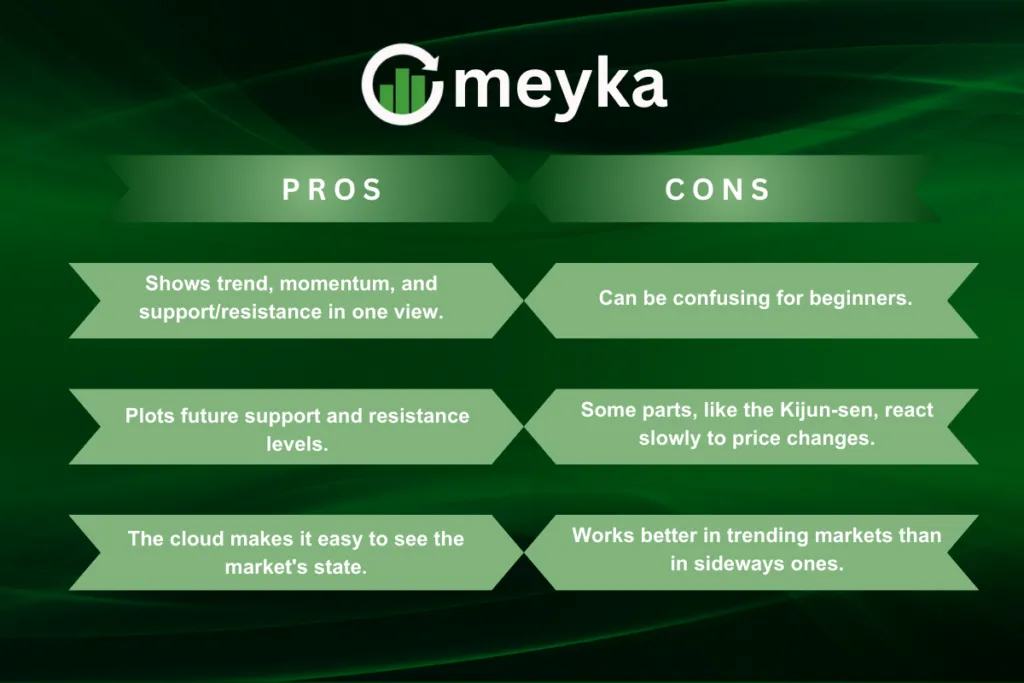
Pros and Cons of Ichimoku Cloud
Final Words
The Ichimoku Cloud is a powerful tool for traders. It helps us see trends, momentum, and key levels. It might seem complex at first, but with practice, it becomes easier to use.
Remember, no tool is perfect. It’s best to use the Ichimoku Cloud with other indicators and good risk management. We can increase our chances of success.
Frequently Asked Questions (FAQs)
Yes, the Ichimoku Cloud is a reliable tool for identifying trends, support, and resistance levels. It provides a comprehensive view of market conditions.
The Ichimoku strategy can be effective, especially in trending markets. However, its performance varies and may not outperform simpler strategies in all conditions.
The Ichimoku tool is a technical analysis indicator that combines five lines to provide insights into market trends, momentum, and potential support and resistance levels.
Success rates vary. Some traders report around 75% success in trending markets, while others suggest rates between 40% and 60%. Mainly, it depends on market conditions and strategy.
Disclaimer:
This content is for informational purposes only and not financial advice. Always conduct your research.
What brings you to Meyka?
Pick what interests you most and we will get you started.
I'm here to read news
Find more articles like this one
I'm here to research stocks
Ask our AI about any stock
I'm here to track my Portfolio
Get daily updates and alerts (coming March 2026)