


Forex trading is like a giant money exchange. We trade one currency for another, hoping to make a profit. Prices go up and down fast. We use forex market analysis for smart trades. This helps us understand price movements. One key tool is forex chart analysis. It shows past and present price trends.
Want to know how it all works? We’ll break it down step by step.
What Is Forex?
Forex, or the foreign exchange market, is where people trade currencies. It is the largest financial market in the world, with over $7 trillion traded daily. Traders buy and sell currency pairs, aiming to profit from price changes.
- It operates 24 hours a day, five days a week.
- Major players include banks, financial institutions, and retail traders.
- The most traded pairs include EUR/USD, GBP/USD, and USD/JPY.
How Does Forex Trading Work?
Forex trading involves exchanging one currency for another. Prices move based on supply and demand, economic news, and market trends.
- Traders use brokers to place trades.
- The goal is to buy low and sell high or sell high and buy low.
- It allows traders to control larger amounts with less money.
What Is Forex Market Analysis?
Forex market analysis helps traders predict price movements. There are two main types:
- Fundamental Analysis: Looks at economic data, interest rates, and news.
- Technical Analysis: Uses past price movements to predict future trends.
Forex Chart Analysis Explained
Forex chart analysis is part of technical analysis. It helps traders find the best entry and exit points for trades. Below is a step-by-step guide:
1. Start With the Monthly Time Frame
- Identify overall market direction.
- Mark key support and resistance levels.
- Draw trend lines to see price movement patterns.
2. Move to the Weekly Time Frame
- Confirm the trend seen in the monthly chart.
- Spot bullish or bearish candlestick patterns.
- Look for price rejection points that indicate strong support or resistance.
3. Analyze the Daily Time Frame
- Find mid-range zones where prices may reverse.
- Identify areas where price previously reacted.
- Use push-and-exhaustion patterns to predict movements.
4. Use the 4-Hour and 1-Hour Charts for Entry
- Look for breakouts of key levels.
- Confirm trade setups using moving averages (50, 100, 200 SMA).
- Enter trades when the price aligns with the overall trend direction.
Example: Swiss Yen (CHF/JPY) Trade Breakdown
Let’s apply these steps to an actual trade:
- Monthly Analysis: The market is trending up, so we mark support and resistance.
- Weekly Analysis: A bullish engulfing candlestick signals buying pressure.
- Daily Analysis: A previous resistance becomes support, signaling a possible buy zone.
- 4-Hour Analysis: A breakout confirms the uptrend, making it a good entry point.
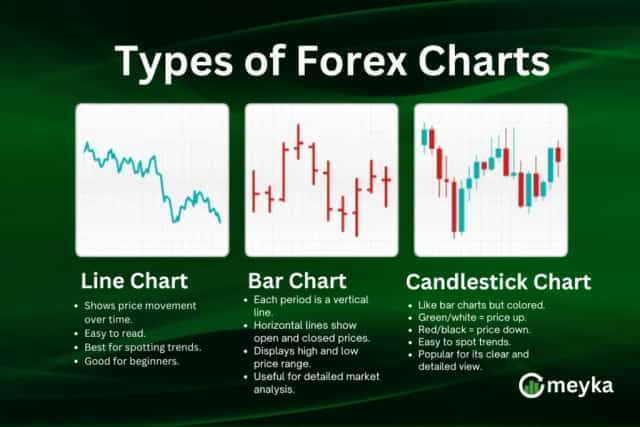
Types of Forex Charts
How to Read Forex Charts Effectively
- Identify Trends: Look for upward (bullish) or downward (bearish) movements.
- Support and Resistance Levels: Find price levels where the market often reverses.
- Chart Patterns: Recognize formations like triangles or head and shoulders that hint at future movements.
Common Forex Trading Strategies
- Trend Following Strategy
- Trade in the direction of the current trend.
- Use tools like moving averages to confirm the trend.
- Breakout Strategy
- Enter the market when the price moves beyond a defined support or resistance level.
- This can signal the start of a new trend.
- Scalping
- Focus on making small profits from minor price changes.
- Involves opening and closing many trades in a short time.
- Swing Trading
- Hold trades for several days to capture short-term market moves.
- Suitable for those who can’t monitor the market constantly.
- News Trading Strategy
- Make decisions based on economic news and data releases.
- Be cautious, as news can cause rapid price changes.
Mistakes to Avoid in Forex Market Analysis
- Combine different analysis methods for a fuller picture.
- Always set stop-loss orders and manage your trade sizes.
- Stick to your plan and avoid decisions based on fear or greed.
- Define your strategy before entering the market.
- Stay updated, as events can impact currency prices.
Conclusion
Forex market analysis is key to making smart trades. By using forex chart analysis, traders can spot trends, confirm setups, and enter at the right time. Whether you’re a beginner or an experienced trader, following a structured analysis approach helps improve decision-making.
Frequently Asked Questions (FAQs)
Chart analysis means studying price movements on a chart. Traders use it to find trends, patterns, and signals for buying or selling.
Forex traders use three main methods:
-> Technical analysis – Studies past price data and charts.
-> Fundamental analysis – Looks at news, economy, and interest rates.
-> Sentiment analysis – Checks how traders feel about the market.
Forex charts show price movements over time. They help traders spot trends and patterns to make better trading decisions.
1. Choose a forex broker.
2. Open a trading account.
3. Deposit money.
4. Pick a currency pair to trade.
5. Analyze the market.
6. Place a trade (buy or sell).
7. Monitor and close the trade when ready.
-> Look at the trend (up, down, or sideways).
-> Check support and resistance levels.
-> Use indicators like moving averages.
-> Watch news and economic events.
-> Avoid trading based on emotions.
Disclaimer
Remember, this analysis is for informational purposes only and should not be considered financial advice. Always conduct your own research or consult a financial advisor before making any investment decisions.
What brings you to Meyka?
Pick what interests you most and we will get you started.
I'm here to read news
Find more articles like this one
I'm here to research stocks
Ask Meyka Analyst about any stock
I'm here to track my Portfolio
Get daily updates and alerts (coming March 2026)