


Gold Rate Falls on MCX Amid Profit Booking; Silver Slides 2% as Market Cools
Gold rate on the MCX slipped sharply on February 26, 2026, as traders booked profits after recent gains. At the same time, silver slid nearly 2%, marking the biggest drop in weeks. This pullback came even as markets showed mixed global cues and investors weighed what comes next. Short‑term traders took money off the table, cooling the momentum that pushed bullion higher earlier in the month.
With global markets still volatile and many unsure where prices are headed next, this latest dip has captured attention from investors and buyers alike. Today’s move shows that even strong rallies can pause quickly when profit-taking sets in, and that metals markets can shift fast.
MCX Price Movements – Today’s Data and Key Levels
On February 26, 2026, gold and silver prices fell on the Multi-Commodity Exchange of India (MCX). Gold April futures dropped around ₹600 (0.4%) to ₹1,60,516 per 10 grams. Silver March contracts fell over ₹5,400 (about 2%), closing near ₹2,62,892 per kg. This shift came after profit booking following recent gains. Global uncertainties and tariff concerns capped further loss.
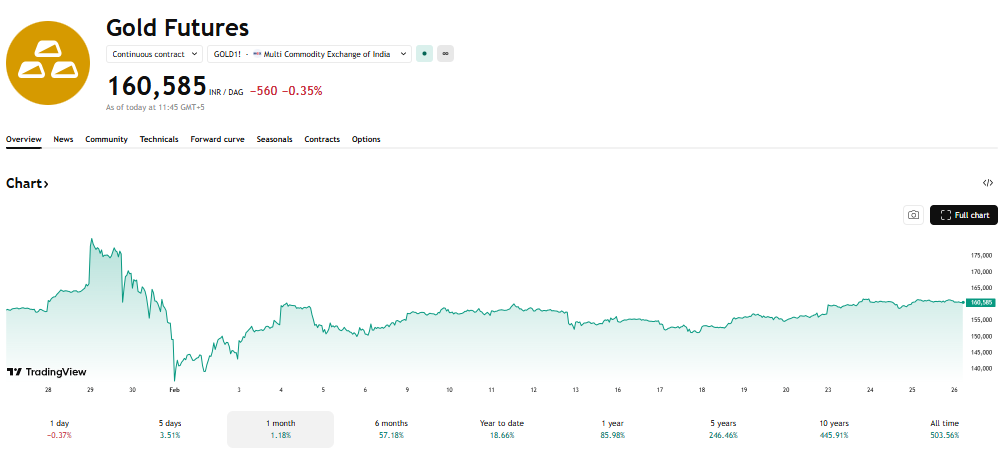
In global markets, spot gold on Comex slipped to around $5,207 per ounce, down roughly 0.37%. Silver retreated from recent highs to near $88.84 per ounce. These price moves show a cooling pattern after several days of volatility and sharp rallies. Traders and analysts watch support levels around ₹1.55 lakh for gold and near ₹2.50-2.60 lakh for silver.
What’s Driving the Drop in Gold and Silver?
Why are traders booking profits now?
Profit booking means traders sell part of their holdings after big gains. Both gold and silver saw strong rallies earlier in late February. Fast gains made traders lock in profits. This pushed prices down on February 26, 2026.
Price action shows markets that run hard often pull back. This is normal. It does not always signal a long‑term trend change.
How is the US dollar impacting prices?
A stronger US dollar usually puts pressure on commodity prices. Gold and silver are priced internationally in dollars. When the dollar gains strength, these metals often weaken. This has been observed in recent sessions.
Global Factors Affecting Bullion Prices
How do global tensions and tariffs matter?
Global trade shocks and tariff stories can push bullion prices higher if investors seek safe havens. Recent talks around US‑Iran relations eased some uncertainty, which reduced safe‑haven demand. This softened silver prices.
Still, ongoing tariff concerns and geopolitical risks remain in the background. Experts say this may keep prices supported in the medium term, even if short‑term swings occur.
What about international markets and COMEX?
COMEX prices act as a guide for Indian markets. On Comex, gold and silver fell modestly on February 26 as well. Spot gold eased after recent highs near $5,230 per ounce. Silver also retreated from earlier peaks near $91/oz. These global cues often influence Indian MCX futures as traders position ahead of international moves.
How is Silver Reacting Compared to Gold?
Silver moved down roughly 2% on MCX on the same trading session. This slide came after silver hit multi‑week highs just days before.
Silver tends to be more volatile than gold. This is because it has both industrial demand and investment demand. When traders shift risk rapidly, silver prices can move more sharply. This makes it sensitive to profit booking and dollar moves.
What Analysts are Saying?
Analysts say the sharp breaks seen recently are technical pullbacks in an overall uptrend for precious metals. For example, markets rallied around February 24-25. Gold crossed key levels near ₹1.60 lakh per 10 grams. Silver also pushed above ₹3 lakh per kg before easing.
Experts mention that long‑term drivers like inflation hedging and geopolitical risk still support gold and silver. Near‑term retracements may appear as traders react to data and profit booking.
How Traders Should Watch Key Levels?
What are the key support and resistance zones?
For gold:
- Support around ₹1.55 lakh-₹1.58 lakh per 10 grams.
- Resistance near ₹1.64 lakh-₹1.66 lakh if bullish sentiment returns.
For silver:
- Support near ₹2.50-₹2.60 lakh per kg.
- Resistance moves back toward ₹2.80 lakh if buying resumes.
These are important levels where buyers and sellers typically react.
What data should traders monitor next?
Traders pay attention to:
- US economic data (jobs, inflation, Fed signals)
- Dollar index movements
- Geopolitical news
- Indian demand patterns
Such events often trigger short‑term moves in bullion prices. AI stock analysis tools show that when sentiment shifts sharply, algorithmic flows can trigger faster price changes. This makes watching macro data even more important near key support zones.
Precious Metals and Broader Market Trends
The recent pullbacks fit into broader trends seen in early February 2026. Bullion prices surged earlier in the month, driven by safe‑haven buying and global tensions. Then markets shifted as trade news and dollar moves created mixed signals.
These mixed trends reflect how gold and silver respond to both financial and geopolitical news. Traders and investors often rotate between equities, bonds, and commodities based on risk appetite.
Gold Rate: What Does This Mean for Investors?
For long‑term investors, gold and silver are still seen as hedges against inflation and risk. Short‑term traders may see this pullback as a chance to re‑enter positions after profit booking. However, they should use risk management and watch key support levels closely.
Silver’s stronger volatility means it may correct faster and sharper than gold, both on the upside and downside.
Conclusion
The recent dip in MCX gold and silver reflects short-term profit booking and a cooling market after recent rallies. While prices eased on February 26, 2026, broader fundamentals like inflation hedging and global uncertainties still support precious metals. Traders should watch key support levels and macro cues, as this pullback may be a pause, not a trend reversal.
Frequently Asked Questions (FAQs)
MCX gold and silver fell on February 26, 2026, mainly because traders booked profits after prices ran up. A stronger US dollar also made bullion more costly for foreign buyers, adding to the weakness. This profit booking and dollar strength weighed on both metals in recent sessions.
The drop may look like a chance to buy, but it is too soon to say for sure. Prices correct after gains, and markets can stay weak longer. Many experts say to watch key support zones before acting. This keeps risk under control.
For MCX gold, traders watch near ₹1.59-1.55 lakh per 10 g as support and ₹1.62+ lakh as resistance. For silver, support lies near ₹2.60-2.55 lakh per kg, with resistance closer to ₹2.72 lakh. These levels may signal price reactions next.
Disclaimer:
The content shared by Meyka AI PTY LTD is solely for research and informational purposes. Meyka is not a financial advisory service, and the information provided should not be considered investment or trading advice.