Did you know that just 10% of the world’s people own over 75% of the global wealth? That’s a big gap. It shows how uneven money is shared. This is called income inequality. And to measure it, we use something called the Gini Index.
The Gini Index is a number that tells us how fair (or unfair) income is spread in a country. A low number means people earn around the same. A high number means a few people have most of the money, while many have very little. It helps us understand how rich or poor countries really are, not just by size, but by fairness.
Let’s look at what the Gini Index means, how it’s used, and why it matters. We’ll explore which countries are most equal and which are not. We’ll also talk about what causes these gaps and what the Gini Index can’t show us.
What is the Gini Index?
The Gini Index is a number that shows how income is shared in a country. It was created in 1912 by an Italian named Corrado Gini. This index helps us see if money is spread out fairly or if some people have much more than others.
The Gini Index ranges from 0 to 1:
- 0 means perfect equality, everyone earns the same.
- 1 means perfect inequality, one person has all the income, and everyone else has none.
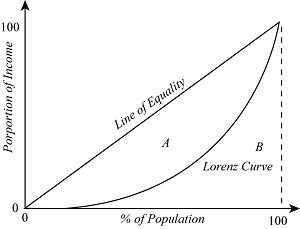
We use a graph called the Lorenz Curve to understand this better. This curve shows the actual income distribution compared to a line of perfect equality. The more the curve bends away from the line, the higher the Gini Index, indicating more inequality.
Example: If Country A has a Gini Index of 0.25, it means income is shared fairly equally. But if Country B has a Gini Index of 0.60, it means there’s a big gap between the upper and the middle class.
Importance of the Gini Index
The Gini Index is important because it helps us understand income inequality in a country. Governments, economists, and policymakers use it to make decisions.
For example, if a country’s Gini Index is high, it may indicate that wealth is concentrated among a few people. This can lead to social problems like crime or poor health outcomes.
Governments looking at the Gini Index,then decide to implement tax policies or social programs to help distribute income more fairly. For instance, progressive taxes, where the rich pay a higher percentage, can reduce income inequality.
A country’s Gini Index helps reflect the fairness of its economic structure. It shows whether the economy benefits everyone or just a few.
Global Gini Index Rankings
According to the World Bank, these countries rank highest and lowest in terms of the Gini Index:
Countries with the Lowest Gini Index (More Equal):
- Slovenia
- Slovakia
- Ukraine
Countries with the Highest Gini Index (Less Equal):
- South Africa
- Namibia
- Brazil
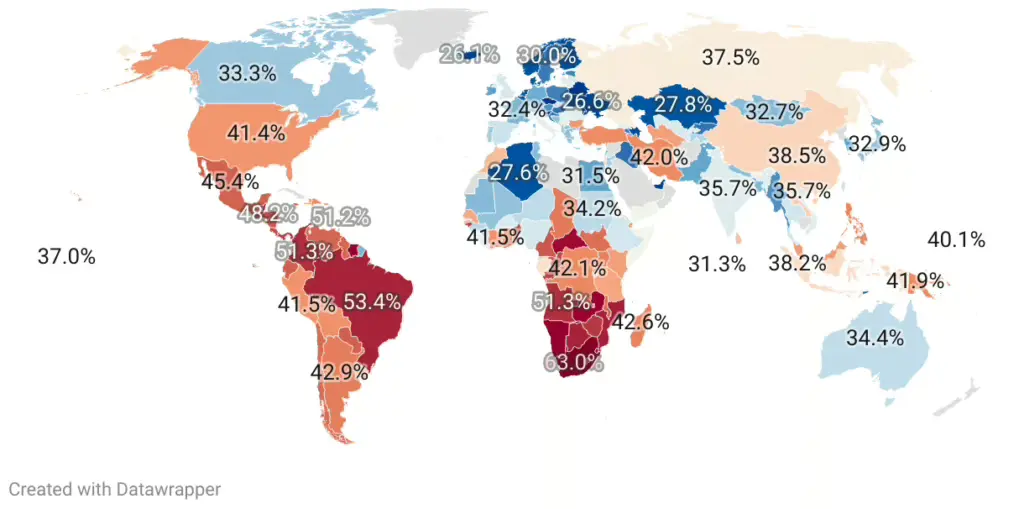
Regional Trends:
- Latin America often has high Gini Index scores, and indicates significant income inequality.
- Sub-Saharan Africa also shows high inequality in many countries.
- Scandinavian countries like Sweden and Norway typically have low Gini Index scores, reflecting more equal income distribution.
These rankings help us understand where income inequality is most and least severe around the world.
Factors Influencing Gini Index Scores
Several social and economic factors can shift a nation’s Gini Index either way:
- Countries relying heavily on agriculture may have different income distributions compared to industrialized nations.
- Access to quality education can lead to better job opportunities and income equality.
- High unemployment can increase income inequality.
- Taxation and social welfare programs can redistribute income and affect the Gini Index.
Countries address these factors, and can work towards a more balanced income distribution.
Criticism and Limitations of the Gini Index
Gini Index is a useful tool, but it has some limitations:
- It doesn’t measure absolute poverty. It shows income distribution but not whether people have enough to meet basic needs.
- It can be misleading. Two countries can have the same Gini Index but different income levels.
- It doesn’t account for differences in living costs between regions.
Therefore, while the Gini Index provides insight into income inequality, it should be used alongside other indicators for a complete picture.
Final Thoughts
The Gini Index is a valuable tool for understanding how income is distributed within a country. It helps identify inequality and informs policies aimed at creating a fairer society.
However, it’s essential to consider other factors like poverty rates and cost of living to get a comprehensive view. The Gini Index doesn’t show everything, but it’s still very important for tracking income inequality around the world.
Frequently Asked Questions (FAQs)
The Gini coefficient measures income inequality, ranging from 0 (perfect equality) to 1 (maximum inequality). A higher value indicates a greater gap between the upper and lower class in a community.
The Gini index is a percentage version of the Gini coefficient, ranging from 0 to 100. It assesses income distribution within a population; higher numbers show more inequality.
Pakistan’s Gini coefficient was 29.6 in 2018, indicating relatively low income inequality compared to the global average.
A Gini coefficient of 0.4 suggests moderate income inequality. It means income isn’t shared equally; some people earn much more than others.
Disclaimer:
This article is for informational purposes only. Data may vary over time. Always refer to official sources for the latest statistics.
What brings you to Meyka?
Pick what interests you most and we will get you started.
I'm here to read news
Find more articles like this one
I'm here to research stocks
Ask Meyka Analyst about any stock
I'm here to track my Portfolio
Get daily updates and alerts (coming March 2026)