


Do you know that over 60% of investors use financial ratios before buying a stock? That’s because these numbers tell us more than just how much a company earns. They show how well it runs, how safe it is, and whether it’s worth our money.
When we look at companies like Apple, we don’t just care about the iPhones it sells. We want to know how profitable it is, how much debt it holds, and how strong it is compared to rivals like Microsoft or Amazon.
This is where financial ratios help us. These simple formulas turn complex financial data into easy-to-read numbers. They help us ask the right questions:
- Is this company making enough profit?
- Can it pay its bills?
- Is it growing faster than its peers?
- Is the stock price fair?
Interesting? Let’s break down the most important financial ratios. We’ll use real examples, compare companies, and keep things simple.
What are Financial Ratios and Why Do They Matter?
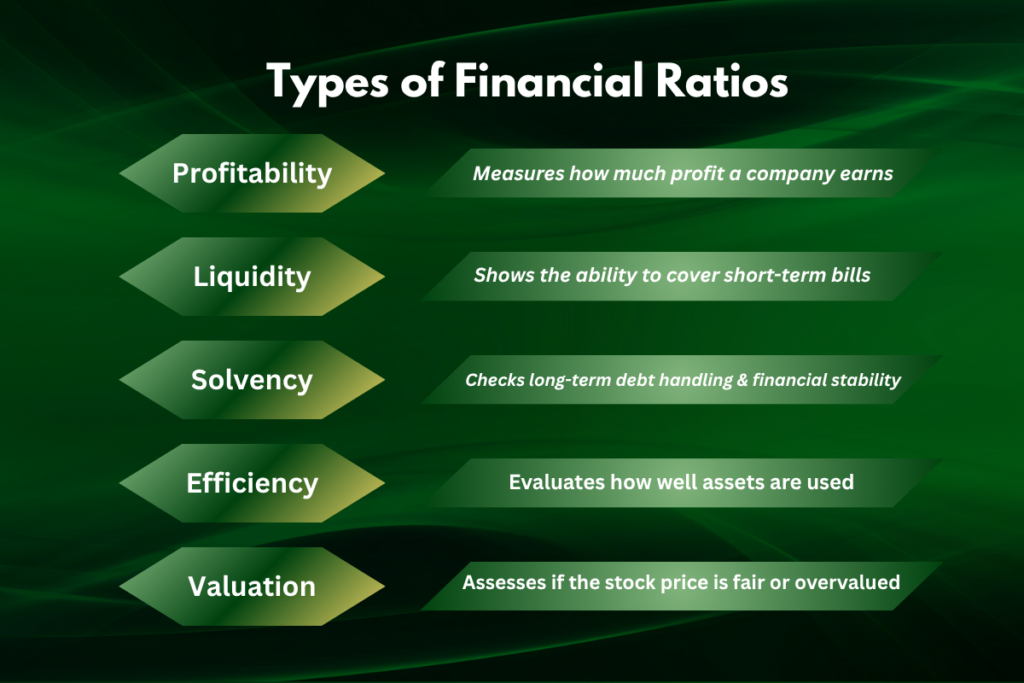
Financial ratios are big tools in smart investing. We take two numbers from a company’s report. Then we divide one by the other. That gives us a ratio we can read and compare. Ratios fall into categories:
These ratios help us spot problems early. They also help us see smart investments. According to FT, simple tools like the P/E ratio can offer a quick price check on stocks.
Profitability Ratios
These show how well a company turns money in.
a. Gross Profit Margin
Formula: (Revenue − COGS) ÷ Revenue.
It shows how much is left after making goods. A higher rate is better.
b. Operating Margin
Formula: Operating Income ÷ Revenue.
It shows profit after running the business. Tech giants often score high here.
c. Net Profit Margin
Formula: Net Income ÷ Revenue.
This is the final profit after all costs and taxes.
d. Return on Equity (ROE)
Formula: Net Income ÷ Shareholders’ Equity.
It shows how well owners’ money earns more money. Good ROE ranges around 15-20%.
Liquidity Ratios
These check the company’s short-term health.
a. Current Ratio
Formula: Current Assets ÷ Current Liabilities.
In June 2025, Apple had a current ratio of 0.82, below the 10-year average of 1.16. That means they may rely on cash flow, not reserves.
b. Quick Ratio
Formula: (Current Assets − Inventory) ÷ Current Liabilities.
This leaves out slow-moving stock. It gives a cleaner view. Tech companies often skip inventory, so their quick and current ratios are close.
Solvency Ratios
These show if long-term debt is safe.
a. Debt-to-Equity Ratio
Formula: Total Liabilities ÷ Shareholders’ Equity.
Low debt is safer. High debt is riskier if business slows.
b. Interest Coverage Ratio
Formula: EBIT ÷ Interest Expense.
It tells how easily they pay the owed interest each year.
Efficiency Ratios
These measures smart use of assets.
a. Asset Turnover Ratio
Formula: Revenue ÷ Average Total Assets.
Higher means assets are earning more revenue.
b. Inventory Turnover Ratio
Formula: COGS ÷ Average Inventory.
Even if Apple outsources, turnover tells us if they sell fast.
Valuation Ratios
These help us check if the market price is fair.
a. Price-to-Earnings (P/E) Ratio
Formula: Price per Share ÷ Earnings per Share.
As of June 27, 2025, Apple’s P/E is about 31.4 below its one‑year average of ~35.4. A lower P/E may mean the stock is cheaper.
b. Price-to-Book (P/B) Ratio
Formula: Price per Share ÷ Book Value per Share.
It shows what investors pay for each dollar of assets.
c. EV/EBITDA
Formula: Enterprise Value ÷ EBITDA.
It’s good for comparing firms with different debts.
Peer Comparison Snapshot
In 2025, economists expect valuation levels to adjust. Let’s compare Apple to its major rivals:
- Apple: P/E ~31x, current ratio ~0.82, EPS ~$6.44
- Google (Alphabet): Operating margin 34.3%, P/E ~23x, very low debt
Apple earns more profit per share than last year. EPS is $6.44 in early 2025, up 7.8% year over year. Investors are paying less for each dollar of Apple’s earnings than they did before, due to a drop in its P/E multiple.
Using Ratios in Real Life
This year showed how ratios still matter. S&P 500’s P/E is dropping as markets adjust. Investors now mix dividend plays like bonds and dividend stocks into their portfolios.
Tech stocks remain risky but offer big growth. Apple is part of the “Sweet 16” group expected to drive market gains in 2025. That group grew EPS by about 15.8% in 2025, double the S&P 500 average.
Final Thoughts
We used Apple’s 2025 data to learn how ratios work and saw how each ratio adds insight:
- Profit margins show profit power.
- Liquidity flags short-term health.
- Solvency checks long-term risk.
- Efficiency measures performance.
- Valuation answers how fairly the market values a stock.
We saw how Apple compares to Google and the trend of changing market valuations. By mixing ratios with real news, we can think like smart investors. Always use ratios together. Then we’ll see the full picture.
Frequently Asked Questions (FAQs)
Key ratios include P/E ratio, ROE, debt-to-equity, current ratio, and profit margin. They help check the company’s value, strength, and how well it makes money.
The five main ratios are liquidity, solvency, profitability, efficiency, and valuation. These help measure how a company runs, earns, pays debt, and handles its money.
Ratio analysis shows how a company is doing. It helps investors and managers find problems, track growth, and compare one company with another in the same industry.
Financial tools include current ratio, quick ratio, ROE, debt ratio, P/E ratio, and net margin. These help study profits, risk, and how well the business is working.
Disclaimer:
This content is for informational purposes only and not financial advice. Always conduct your research.
What brings you to Meyka?
Pick what interests you most and we will get you started.
I'm here to read news
Find more articles like this one
I'm here to research stocks
Ask our AI about any stock
I'm here to track my Portfolio
Get daily updates and alerts (coming March 2026)