


Dow, S&P 500, Nasdaq Futures Rise After Stocks Hit Lowest Level Since November
U.S. stock markets faced a sharp sell-off on March 12, 2026, pushing the S&P 500 to its lowest level since November. The Dow Jones Industrial Average dropped more than 700 points, while the Nasdaq Composite also fell as investors reacted to rising oil prices and global tensions. The sudden drop raised new concerns about inflation and interest rates.
However, early trading signals show a different mood. U.S. stock futures are now moving higher, hinting that investors may be stepping back into the market after the steep decline. Many traders see this as a possible rebound moment. Still, uncertainty remains. The big question now is simple: Is this the start of a market recovery, or just a short pause in ongoing volatility?
Why Did the S&P 500 Drop to Its Lowest Level Since November?
What triggered the recent market sell-off?
The S&P 500 fell sharply on March 12, 2026, reaching its lowest level since November after a wave of global economic concerns hit Wall Street. Several factors combined to push stocks lower:
- Oil prices surged above $100 per barrel, the first time since 2022.
- The jump followed escalating tensions in the Middle East and threats to block the Strait of Hormuz, a major global oil shipping route.
- Higher energy prices quickly revived fears of rising inflation.
As markets reacted, the Dow Jones Industrial Average dropped 739 points (1.6%), while the Nasdaq Composite declined 1.8%. Energy companies were among the few stocks that gained during the session. Investors worry that higher oil prices could keep inflation elevated and delay expected interest-rate cuts from the Federal Reserve.
Dow, S&P 500, and Nasdaq Futures Rise: What Does It Mean?
Is the market starting to recover?
After the steep sell-off, U.S. stock futures moved higher in early trading. Futures contracts often show how investors expect markets to open in the next session. A rise in futures suggests several possible developments:
- Dip buying by institutional investors
- Short-term relief after panic selling
- Expectations that the market may stabilize
However, analysts caution that futures gains do not guarantee a full recovery. Volatility can remain high when markets face geopolitical risks and economic uncertainty.
In recent weeks, the S&P 500 has experienced its largest three-day drop in about a month, highlighting how sensitive markets are to global events.
Key Market Drivers Investors are Watching
1. Middle East tensions and oil supply risk
The biggest catalyst behind the recent market drop is geopolitical conflict in the Middle East. Reports indicate attacks on oil tankers and threats to close the Strait of Hormuz. This route carries a significant share of global oil shipments.
If supply disruptions worsen:
- Oil prices could rise further
- Global inflation may increase
- Economic growth may slow
These factors directly affect investor sentiment and equity markets.
2. Federal Reserve policy expectations
The Federal Reserve is expected to hold a key policy meeting around March 17, 2026. Markets are closely watching for signals about:
- Interest-rate cuts
- Inflation outlook
- Economic growth expectations
If inflation remains high due to energy costs, the Fed may delay rate cuts. That would put additional pressure on growth stocks and technology companies.
3. Bond yields and borrowing costs
U.S. Treasury yields have risen as investors price in persistent inflation risks. Higher yields can hurt equities because:
- Borrowing becomes more expensive for companies
- Valuations of growth stocks decline
- Investors shift money from stocks into bonds
This relationship often explains why technology stocks fall more sharply during periods of rising interest rates.
Sector Winners and Losers During the Market Turmoil
Which industries benefited from the sell-off?
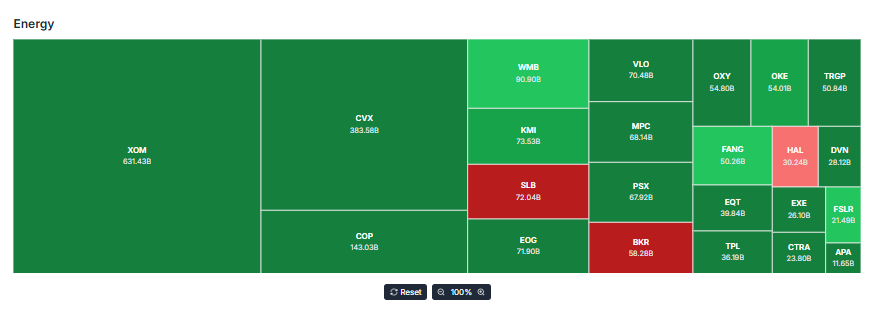
Not all sectors moved lower during the recent volatility. Energy companies performed strongly because rising oil prices improved their revenue outlook. Fertilizer and chemical stocks also gained as commodity prices increased. Other sectors struggled.
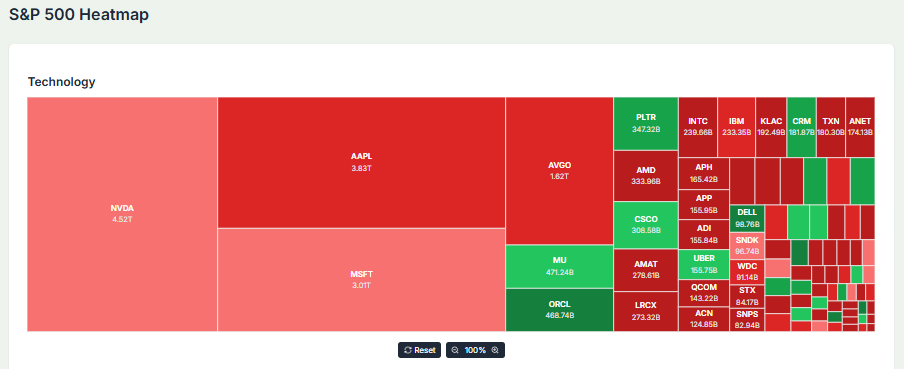
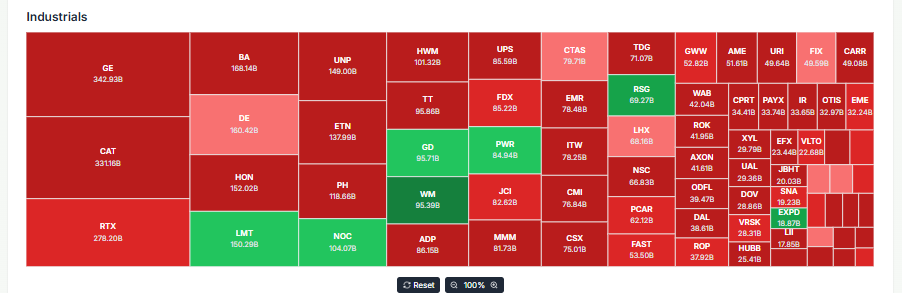
Technology and industrial stocks saw the biggest losses, as investors moved away from riskier assets. Key sector trends:
- Energy stocks: gains due to the oil price surge
- Technology stocks: losses amid rate concerns
- Industrial companies: pressured by economic uncertainty
- Defensive sectors such as utilities: relatively stable
These shifts reflect a classic market rotation toward defensive investments.
S&P 500 Technical Analysis and Forecast
Short stock details and price outlook
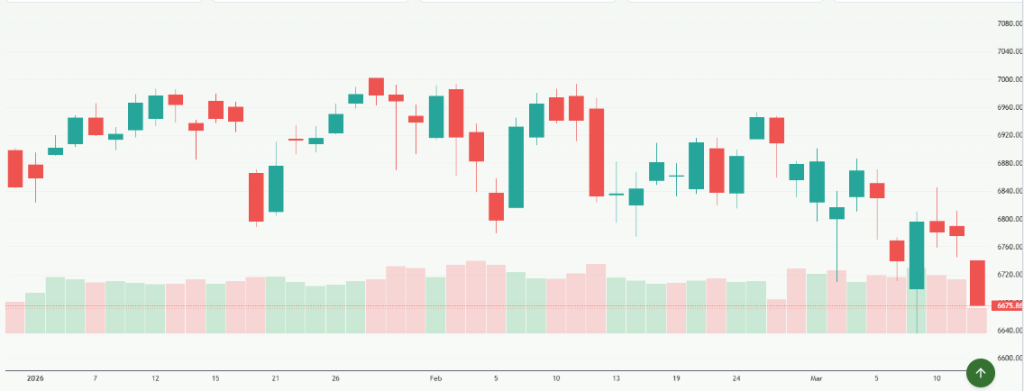
According to market forecasting data, the S&P 500 is currently trading near 6,812.60. Short-term signals remain cautious after the recent decline. Forecast highlights include:
- 1-month projection: around 6,598
- 2026 forecast: about 6,216
- 2030 projection: near 8,351
- 7-year potential: about 9,879
These projections suggest short-term volatility but stronger long-term growth potential.
Technical indicators traders are watching
Technical analysts are closely monitoring key support levels. Important levels include:
- Support: 6,500-6,550
- Resistance: near 6,720
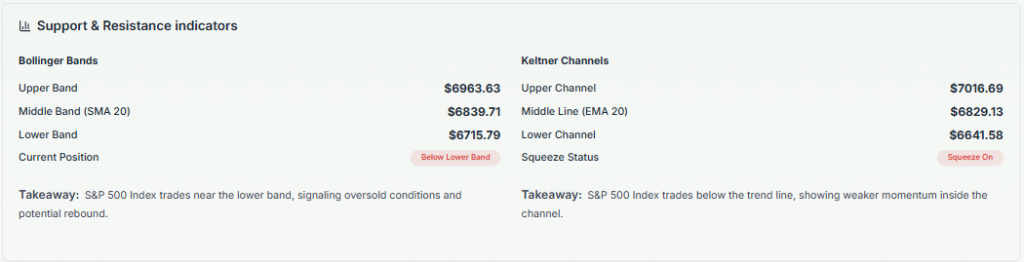
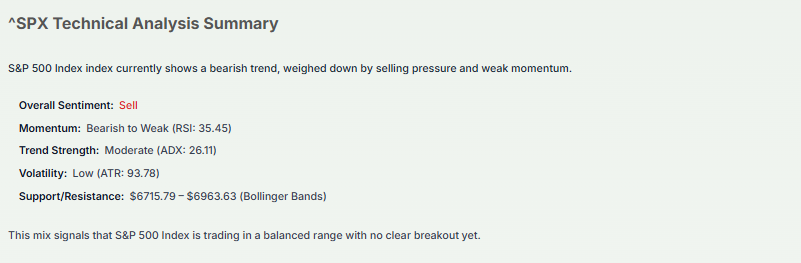
Recent technical signals show the index breaking below a key support zone, which could signal a deeper correction if selling pressure continues. Indicators showing caution include:
- Weak market breadth
- Rising volatility levels
- Downward-sloping moving averages
These signs suggest markets may remain unstable in the short term.
What Meyka Says About the S&P 500?
Data from Meyka’s AI stock analysis tool suggests the S&P 500 currently has a bearish short-term outlook, even though long-term projections remain positive. Key insights from the analysis:
- Current trend momentum: bearish
- Short-term outlook: downward pressure likely
- Long-term trend: sideways to bullish over several years
The model indicates macroeconomic factors will strongly influence the index in 2026. These include:
- Interest-rate policy
- Corporate earnings growth
- Global geopolitical stability
S&P 500 Today: What Other Analysts are Saying?
Wall Street analysts remain divided on the S&P 500 outlook. Some forecasts remain optimistic.
- The average strategist target for 2026 is about 7,555, implying moderate upside from current levels.
- Some investment banks expect the index to reach 7,500-7,800 if earnings growth remains strong.
However, risks remain. Analysts warn that rising bond yields, geopolitical tensions, and inflation could trigger a correction before markets resume their upward trend. For investors, this means markets may experience short-term volatility but long-term growth potential.
Bottom Line
The recent drop in the S&P 500 highlights how quickly global events can shake investor confidence. Rising oil prices, geopolitical tensions, and uncertainty around Federal Reserve policy are driving current market volatility.
While futures gains suggest a short-term rebound, the broader outlook remains uncertain. Investors will continue watching inflation data, interest-rate signals, and energy prices closely to determine whether markets stabilize or face further downside in the coming weeks.
Frequently Asked Questions (FAQs)
The S&P 500 dropped on March 12, 2026, after oil prices surged and geopolitical tensions increased inflation fears and uncertainty.
Markets may recover if inflation cools and the Federal Reserve signals rate cuts later in 2026.
Futures often rise after sharp losses as investors buy dips and expect markets to stabilize following heavy selling.
Disclaimer:
The content shared by Meyka AI PTY LTD is solely for research and informational purposes. Meyka is not a financial advisory service, and the information provided should not be considered investment or trading advice.
What brings you to Meyka?
Pick what interests you most and we will get you started.
I'm here to read news
Find more articles like this one
I'm here to research stocks
Ask our AI about any stock
I'm here to track my Portfolio
Get daily updates and alerts (coming March 2026)