


Crude Oil Nears $108/bbl Amid US-Iran Tensions; COMEX Gold Drops 1% as US Stocks End Week Lower
Crude oil prices have been on a wild ride this March. On March 30, 2026, Brent crude surged past $108 per barrel as rising US‑Iran tensions kept energy markets on edge. Traders are pricing in risks to supply, especially with strategic routes like the Strait of Hormuz under strain and broader conflict claims expanding across the Middle East.
At the same time, key markets are showing unusual moves. Traditional safe havens such as COMEX gold have dipped instead of rallied, and major US stock indices ended last week lower amid the crosscurrents of geopolitics and inflation fears. This blend of soaring oil, softening gold, and shaky stocks sets the stage for a compelling look at how global uncertainty is reshaping markets.
Crude Oil Markets Under Geopolitical Fire
What’s driving crude oil prices near $108 per barrel?
Crude oil prices have stayed high as global markets grapple with ongoing US‑Iran tensions, a conflict now more than a month old, disrupting energy markets. Escalation in military actions and attacks by Iranian‑aligned forces has raised fears of supply cuts, especially through key routes such as the Strait of Hormuz, where roughly 20 % of the world’s oil flows.
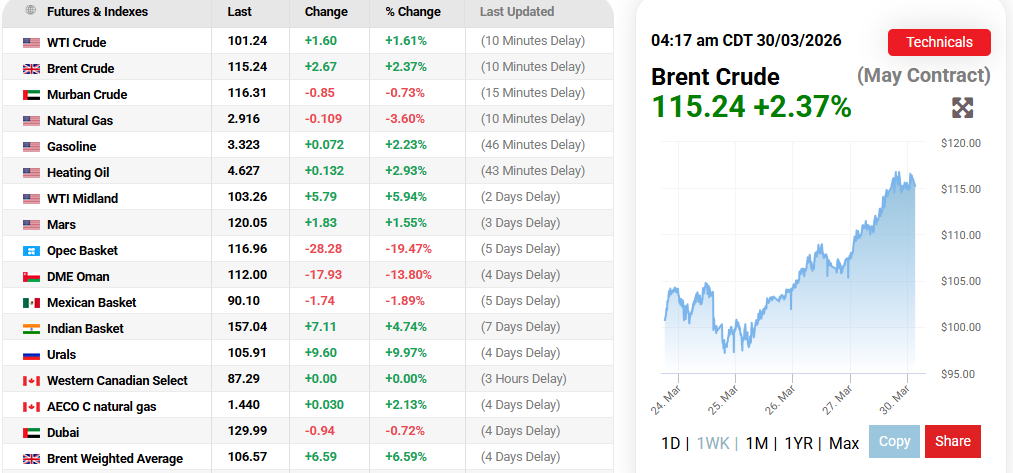
As a result, Brent crude soared past $110 per barrel on March 27, 2026, before settling near $108, while U.S. West Texas Intermediate (WTI) still traded close to $97-$99. These levels reflect a strong risk premium amid uncertainty about the conflict’s duration.
Global benchmark Brent has climbed more than 50 % since late February, largely due to fears that supply bottlenecks and infrastructure damage will persist. The surge has also come alongside repeated closures and disruptions in shipping lanes, worsening price volatility, and pushing energy markets into a prolonged risk‑off stance.
How does this conflict threaten supply routes?
The 2026 Strait of Hormuz crisis has been a core reason behind the oil price surge. Since late February, Iran’s actions have effectively blocked much of the tanker traffic through this crucial channel, sharply reducing shipments of crude and liquefied natural gas (LNG). The blockade has cut about 20 % of global oil supply from moving normally, adding a structural risk premium to prices. Shipowners have largely avoided transits, and insurance costs have spiked, further tightening logistics and supply chains.
These disruptions not only affect crude pricing but have also strained global energy markets, forcing traders and producers to consider alternative shipment routes and emergency mechanisms to manage supply access.
Are Oil prices dropping at all?
Yes, there is evidence that prices can shift quickly with new geopolitical developments. In late March, temporary signs of easing, including diplomatic talks and a suggested pause in direct energy infrastructure strikes, briefly pulled Brent crude lower. At one point, prices slipped below $95, and traders interpreted this as a short‑term repricing of geopolitical fears rather than a full relief.
However, experts still caution that any real respite in oil prices depends on sustained de‑escalation or a stable reopening of critical supply routes like the Strait of Hormuz. Otherwise, risk premiums will keep prices elevated and volatile.
Precious Metals: Gold’s Mixed Moves
Why hasn’t gold rallied strongly despite global risk?
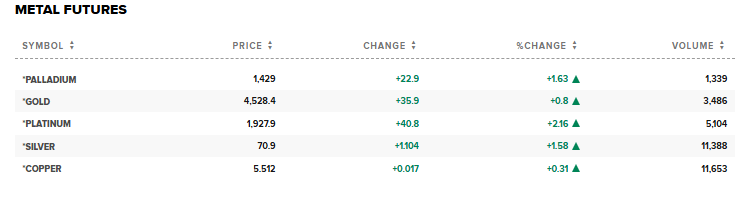
Gold’s price reactions have been uneven compared with oil. Typically, geopolitical conflict drives safe‑haven demand for gold, but recent price action has shown more complexity. Spot gold rebounded slightly on March 30, trading near $4,500 per ounce, after facing sharp volatility last week.
A key reason gold hasn’t dominated safe‑haven flows is the monetary policy context. With the U.S. Federal Reserve signalling that interest rates may stay higher for longer, bonds and cash alternatives look relatively more attractive, reducing demand for non‑yielding assets like gold. A stronger U.S. dollar also makes gold pricier in global markets, further dampening buying pressure.
In fact, gold saw one of its worst weekly performances since 1983, with an approximate 11 % decline as risk pricing shifted and traders assessed macro forces rather than purely focusing on geopolitics.
Is this a trend or a short‑term move?
Some analysts argue the current dip is temporary positioning driven by short‑term trading flows and the oscillation of the U.S. dollar and rate expectations. Historically, gold has seen buying windows even after pullbacks, and long‑term demand could re‑emerge if conflict risks deepen or inflation persists.
Investors tracking gold might also watch real yields and central bank signals, as these fundamentally influence precious metals over time.
US Equities: Stocks Under Pressure
How are US stocks reacting?
U.S. stock markets have felt persistent pressure from geopolitical uncertainty. Futures for major indexes such as the S&P 500, Dow Jones, and Nasdaq all showed downward movement as of March 30, 2026. For example, futures dipped roughly 0.45% to 0.5% across major benchmarks, signaling cautious sentiment among traders facing renewed escalation risk.
This decline followed a weak finish on Wall Street last week, where concerns about the Iran war, rising energy costs, and dampened risk appetite outweighed brief diplomatic relief headlines.
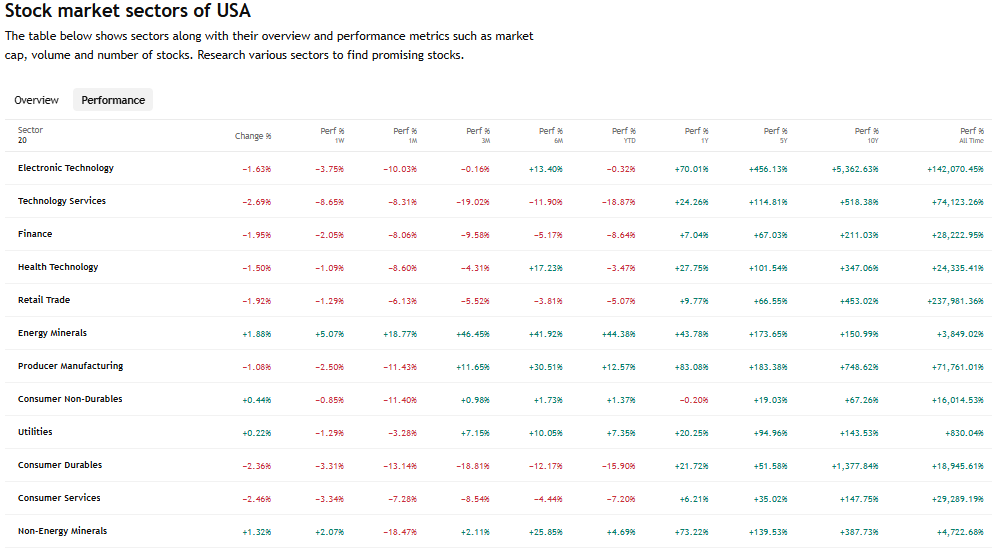
Which sectors are most affected?
Risk‑sensitive sectors such as technology and consumer discretionary have been under selling pressure as investors trim exposure to equities. Defensive sectors like utilities and healthcare tend to outperform during such risk‑off periods, though gains there have been modest due to broad market unease.
Crude Oil Prices Impact: Macro Ripples & Market Outlook
How could this impact inflation and central bank policy?
Rising oil prices tend to push up inflation expectations. This can place pressure on central banks like the U.S. Federal Reserve to keep interest rates elevated longer, delaying rate cuts and supporting the U.S. dollar. Higher energy costs can also feed into consumer prices, affecting spending and growth.
Some early economic forecasts suggest that jobs data, manufacturing activity, and consumer sentiment could face headwinds if oil prices remain elevated, given their influence on transportation and production costs.
What scenarios could play out next?
Markets remain sensitive to shifts in geopolitical developments. Possible paths include:
- Escalation in the Middle East, which could push oil even higher and lift safe‑haven assets over time.
- Temporary de‑escalation through diplomacy or ceasefires, which could ease oil back below key resistance levels before prices rebound.
- Monetary policy shifts, where central banks adjust outlooks based on inflation and growth signals.
Traders increasingly use advanced tools such as AI stock analysis to parse complex macro drivers and forecast short‑term price patterns across assets.
Wrap Up
Oil markets remain tight as US‑Iran tensions reshape supply fears, keeping crude near $108 a barrel while gold shows mixed signals under macro pressure, and US stocks stay cautious.
Together, these markets reveal how geopolitical risk, inflation expectations, and monetary policy are intersecting in 2026. Investors should watch conflict developments, rate outlooks, and broader economic data, all of which could quickly redefine risk assets and price trends in the weeks ahead.
Frequently Asked Questions (FAQs)
Crude oil prices reached near $108 per barrel on March 30, 2026, due to US-Iran tensions and supply risks.
Gold stayed lower on March 30, 2026, as a stronger US dollar and high interest rates reduced safe-haven demand.
Disclaimer:
The content shared by Meyka AI PTY LTD is solely for research and informational purposes. Meyka is not a financial advisory service, and the information provided should not be considered investment or trading advice.
What brings you to Meyka?
Pick what interests you most and we will get you started.
I'm here to read news
Find more articles like this one
I'm here to research stocks
Ask our AI about any stock
I'm here to track my Portfolio
Get daily updates and alerts (coming March 2026)