


Chaikin Money Flow helps traders spot buying and selling pressure in the stock market. Developed by Marc Chaikin in the 1980s, this tool measures money flow using price and volume data over a set period, usually 21 days. Traders use it to predict price movements and make smarter decisions.
This indicator is simple yet powerful. It shows if more money is flowing into a stock, signaling a potential rise, or out of it, hinting at a drop.
By the end of this article, you’ll know how to calculate it, read its signals, and apply it to your trading.
What Is Chaikin Money Flow?
Chaikin Money Flow, or CMF, tracks money moving in and out of a stock. Marc Chaikin, a stockbroker since 1965, created it in the 1980s. It mixes price and volume to show if buyers or sellers are calling the shots.
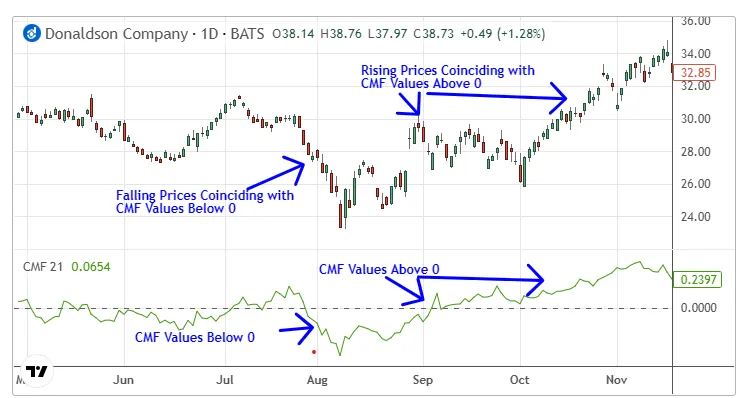
The standard period for CMF is 21 days. Its value swings between -1 and +1, but it usually stays between -0.50 and +0.50. A number above 0 means buying pressure; below 0 means selling pressure.
Marc Chaikin sold his company, Bomar Securities, back in 1992. His indicator remains a favorite in the stock market today. It’s a volume-weighted tool that’s easy to grasp and use.
How Does CMF Work?
CMF uses a three-step method to track how money is moving. First, it finds the Money Flow Multiplier by comparing the closing price to the day’s high and low. Then, it multiplies that by volume to figure out the Money Flow Volume.
The final step averages this over 21 days and divides by total volume. This gives a value that shows the trend’s strength. Traders watch this number to understand stock market shifts.
For example, a positive CMF means there’s more buying than selling going on. A negative CMF points to the opposite. It’s a clear way to see what’s happening behind the price.
Reading CMF Signals
| CMF Value/Pattern | Interpretation | Signal Type |
|---|---|---|
| Above 0 | Buying pressure is dominant | Bullish |
| Below 0 | Selling pressure is dominant | Bearish |
| Around +0.25 or -0.25 | Indicates strong bullish or bearish trend | Strong Trend |
| At +0.20 or -0.20 | Suggests a very strong potential price move | Very Strong Signal |
| Near 0 | Market is balanced; potential pause before trend reversal | Neutral/Consolidation |
| Zero-line cross | Movement across 0 can signal a buy (upward cross) or sell (downward cross) | Entry/Exit Signal |
| CMF vs. Price Divergence | Disagreement between CMF and price may suggest trend reversal | Reversal Warning |
Using Chaikin Money Flow in Trading
Chaikin Money Flow works best when you use it with other tools. It’s not a solo act but a helper for better trades. Combine it with moving averages or MACD for stronger signals.
For instance, use a 15-period moving average. If CMF crosses above 0 and the price is above the average, consider buying. If it dips below 0 and the price falls under, think about selling.
Always set a stop loss. In a fast 2-minute setup, place it below the moving average. This limits risk in the unpredictable stock market.
Sample Trading Plan
Here’s a basic way to use CMF:
- Buy: CMF above 0, price above 15-period moving average.
- Sell: CMF below 0, price below 15-period moving average.
- Stop Loss: Below the average for buys, above for sells.
This plan keeps things simple. It uses Chaikin Money Flow to confirm trends. Adjust it to fit your style.
Final Thoughts
Chaikin Money Flow is a handy guide for stock market traders. It shows who’s winning—buyers or sellers—with just one number. Used right, it can boost your trading decisions.
Pair it with other tools and a stop loss for safety. While it has limits, its insights are valuable. Practice with it to see how it fits your plan.
Disclaimer:
This content is made for learning only. It is not meant to give financial advice. Always check the facts yourself. Financial decisions need detailed research.
What brings you to Meyka?
Pick what interests you most and we will get you started.
I'm here to read news
Find more articles like this one
I'm here to research stocks
Ask our AI about any stock
I'm here to track my Portfolio
Get daily updates and alerts (coming March 2026)