


The Commonwealth Bank of Australia (CBA) is one of the biggest banks in Australia. Many investors watch its share price closely. If we want to invest in CBA, we need to know how to analyze its stock.
This article will show us four simple ways to do that. We will look at fundamental analysis, technical analysis, sentiment analysis, and macroeconomic factors.
We can make better choices about buying or selling CBA share price using these methods.
Let’s have a look!
Fundamental Analysis
Fundamental analysis shows a company’s true value. It looks at the company’s finances and the economy. For CBA, we check its income statement, balance sheet, and key ratios.
Key Factors:
- Financial Statements: CBA’s half-year profit was A$5.13 billion. This growth came from home lending and deposits.
- Key Ratios: The bank’s net interest margin increased to 2.08%, indicating improved profitability.
- Economic Environment: Despite rising living costs, CBA’s strong mortgage portfolio and net interest margins have supported its performance.
We analyze these factors, can assess CBA’s long-term value and make informed investment decisions.
Technical Analysis
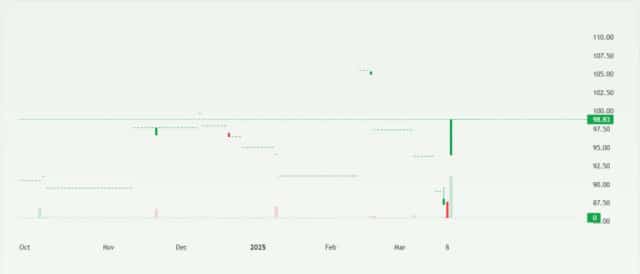
Technical analysis involves studying past market data, primarily price and volume, to forecast future price movements.
Key Indicators:
- Moving Averages: CBA’s 5-day moving average is A$158.12, suggesting a bullish trend.
- RSI (Relative Strength Index): An RSI of 65.24 indicates that CBA’s stock is approaching overbought conditions.
- MACD (Moving Average Convergence Divergence): A MACD of 2.02 suggests a potential sell signal.
These indicators help us identify potential buy or sell signals and understand market momentum.
Sentiment Analysis
Sentiment analysis gauges the mood of investors and the public towards CBA, influencing its stock price.
Methods:
- News Analysis: Recent reports highlight CBA’s record interim dividend and strong profits. This boosts investor confidence.
- Social Media and Analyst Reports: Positive discussions and analyst upgrades can drive demand for CBA’s shares.
Market responses help us understand stock price changes and predict investor behavior.
Macroeconomic Factors
Macroeconomic factors include broad economic indicators that impact CBA’s performance.
Key Indicators:
- GDP Growth Rates: Stronger economic growth can lead to higher demand for banking services.
- Inflation and Interest Rates: Lower inflation and potential interest rate cuts may boost consumer spending and borrowing.
- Global Economic Trends: Geopolitical events and global trade policies can affect market stability and investor confidence.
These factors influence CBA’s operating environment and can affect its stock performance.
Closing
We can get a full picture of CBA share price by using fundamental analysis, technical analysis, sentiment analysis, and understanding macroeconomic factors. Each method provides different insights to help us make better decisions.
Staying updated with the latest financial news and market trends helps us invest smartly.
Frequently Asked Questions (FAQs)
Analysts predict CBA’s share price could range from A$90.75 to A$142.00, with an average target of A$113.80.
Some analysts believe CBA is overvalued and suggest a potential decline of up to 23%.
Forecasts estimate CBA’s stock price could reach A$190.04 by the end of 2025.
CBA shares first floated at A$5.40 per share in September 1991.
Disclaimer:
This content is for informational purposes only and not financial advice. Always conduct your own research.
What brings you to Meyka?
Pick what interests you most and we will get you started.
I'm here to read news
Find more articles like this one
I'm here to research stocks
Ask Meyka Analyst about any stock
I'm here to track my Portfolio
Get daily updates and alerts (coming March 2026)