


Bond markets have entered a turbulent phase in early March 2026 as crude oil prices surge amid escalating conflict in the Middle East. Brent crude recently climbed above $80 a barrel, lifting inflation fears and shaking traditional safe‑haven dynamics across global markets.
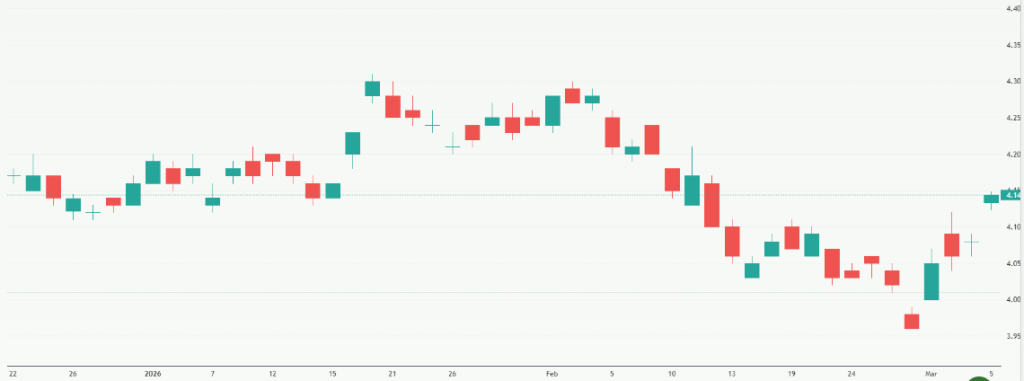
With energy costs triggering a sharp reaction in yields, and the U.S. Treasury 10‑year note briefly spiking over 4.13% on March 5, bond traders are now turning their full attention to upcoming U.S. labor market data to reassess economic risks and the Federal Reserve’s future path.
As job figures loom, traders see these numbers as a key signal that could confirm, delay, or derail expectations around interest rate cuts in an already volatile market.
Market Backdrop: Oil Price Shock & Its Ripple Effects
What Is Driving the Oil Price Spike?
Global energy prices have shot higher as geopolitical tensions in the Middle East worsen. Oil has climbed sharply above $80-$85 per barrel in early March 2026, marking one of the most rapid rallies in recent months. The surge reflects fears over supply disruptions tied to a widening U.S.-Israel-Iran conflict, including attacks on shipping and possible closure of key routes like the Strait of Hormuz.
Since late February, crude prices have jumped by more than 16-18%, stoking inflation concerns across markets. This rise is not just about oil itself; it affects inflation expectations and costs across the global economy.
Oil’s rise has flipped typical risk flows. In most conflicts, traders flock to government bonds for safety. Today, they sell bonds because oil‑linked inflation fears outweigh the usual “flight to quality.” This unusual reaction shows how strong the inflation signal has become.
How are Markets Reacting to the Spike?
Higher oil is spilling over into other markets. U.S. Treasury yields have climbed for four straight days, with the benchmark 10‑year yield hitting roughly 4.13% on March 5, 2026. This represents rising inflation risk and diminished faith in near‑term interest rate cuts. Mortgage rates have also edged up, with the average 30‑year rate returning to near 6% after a recent slide.
The bond sell‑off has broader implications. Stocks have also fallen, particularly in sensitive sectors like tech and airlines. The U.S. dollar has strengthened as yields rise. Even markets globally reflect this shift, with European and Asian bond markets closely tracking the move in oil and yields.
Labor Market Data – A Critical Pivot Point for Bonds
Why are Investors Watching Labor Data Closely?
Labor market numbers, especially the U.S. February jobs report expected in early March, have become central to bond market strategy. Traders now see labor data as a key gauge of inflation persistence and economic strength.
Strong jobs figures and wage growth would suggest that inflation pressures are widespread and not limited to energy costs. That outcome could justify higher yields and delay any Federal Reserve rate cuts. Conversely, weaker labor results could fuel hopes of slower inflation and renewed easing expectations.
Bond traders are especially focused on:
- Nonfarm Payrolls growth signals economic momentum.
- Unemployment rate at low levels means tight labor markets.
- Wage growth trends: Stronger wages can feed inflation.
These components offer clues about future inflation and the Fed’s policy path.
How Could Jobs Data Impact Bond Yields?
If labor data shows continued strength, yields could rise further as traders price out rate cuts. Yields on both short‑ and long‑term Treasuries may climb if inflation risk is viewed as pervasive. Some market tools, including AI‑driven stock and bond analysis tools, now help traders model how job numbers update inflation forecasts and impact yields.
Alternatively, a softening labor market, with slowing job creation or rising unemployment, could ease yield pressures. That outcome may restore some expectations for Fed easing later in 2026. But current geopolitical risk and oil price volatility make this less certain.
Treasury Market Response, Yields, Curves, and Volatility
How Have Treasury Yields Moved?
Treasury yields have reacted strongly to the oil shock and inflation fears. The 10‑year Treasury yield jumped to around 4.13% on March 5, marking a significant move away from the idea of a safe‑haven bid. Market behavior shows that inflation pressures, not fear of growth slowdown, are driving bond pricing right now.
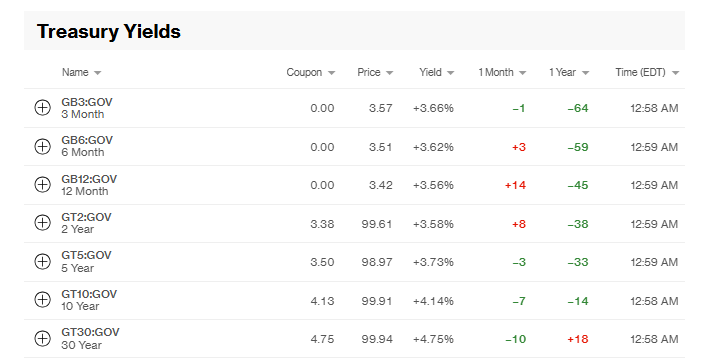
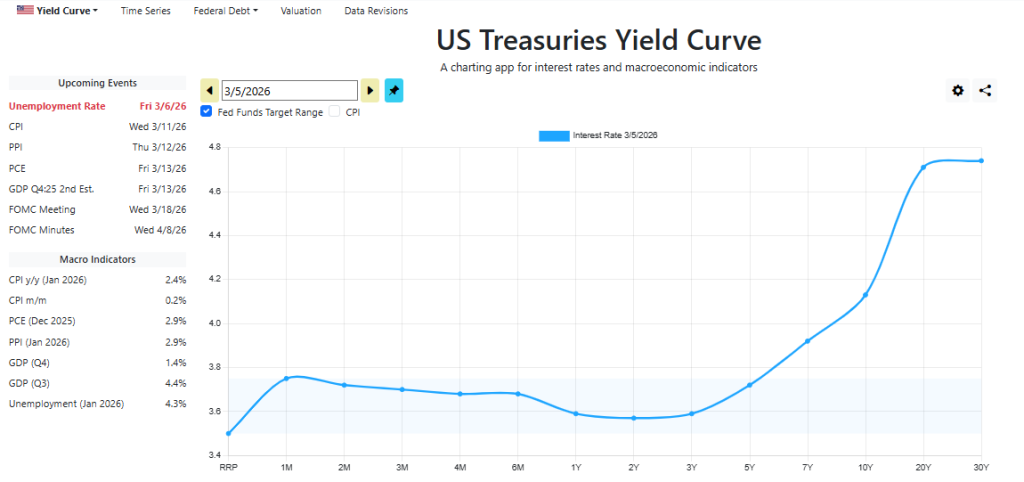
The yield curve has also shifted. Shorter‑term yields, like the 2‑year note, reflect changing rate expectations more directly, and they have risen as the odds of rate cuts diminish. This flattening or steepening carries implications for future economic growth and monetary policy forecasts.
What Does Curve Behavior Reveal?
A flatter yield curve often signals slower growth expectations, while a steepening curve can indicate higher inflation risk. Currently, the curve reflects uncertainty: markets are unsure whether inflation will persist or if growth will weaken due to energy costs and geopolitical risks. Traders watch the curve to anticipate how the Federal Reserve might respond, whether to tighten, hold, or eventually ease policy.
Broader Market Implications of Oil Shock and Labor Data
What are the Spillover Effects Beyond Bonds?
The interplay between oil, labor data, and yields affects more than just Treasuries:
- Equities: Higher yields hit growth stocks hard. Tech shares have slid as borrowing costs rise.
- Mortgages: Rising yields push mortgage rates higher, slowing the housing market.
- Global markets: Emerging markets face currency stress as the dollar strengthens. Commodity exporters may benefit, while importers feel inflationary pressure.
- Inflation psychology: If consumers expect higher prices, inflation may become self‑sustaining, complicating central bank responses.
Investors are now exploring inflation hedges such as inflation‑linked bonds and commodities, while reducing exposure to rate‑sensitive assets.
Final Words
As oil prices surge and inflation risks mount, bond traders find themselves in a rare market setup where traditional safe‑haven flows no longer dominate. With key labor numbers ahead, the upcoming jobs data will act as a critical test for inflation expectations and Federal Reserve strategy. How markets interpret this data could shape the trajectory of yields, borrowing costs, and financial markets throughout 2026 and beyond.
Frequently Asked Questions (FAQs)
Rising oil prices in March 2026 pushed inflation fears higher. Treasury yields increased as investors expect higher costs. Bonds lost value, and traders watch yields closely for Fed decisions.
In early March 2026, bond traders monitor jobs reports to gauge inflation and growth. Strong payrolls or wage gains can raise yields. Weak jobs may lower future rate expectations.
As of March 5, 2026, rising Treasury yields show reduced chances of near-term Fed rate cuts. Traders see higher yields as a sign of persistent inflation risk.
Disclaimer:
The content shared by Meyka AI PTY LTD is solely for research and informational purposes. Meyka is not a financial advisory service, and the information provided should not be considered investment or trading advice.
What brings you to Meyka?
Pick what interests you most and we will get you started.
I'm here to read news
Find more articles like this one
I'm here to research stocks
Ask our AI about any stock
I'm here to track my Portfolio
Get daily updates and alerts (coming March 2026)