


Bitcoin has slid sharply toward the $70,000 mark in early February 2026, marking one of its weakest stretches in more than a year. Over the past week, the world’s largest cryptocurrency has struggled to hold key support levels, briefly dipping below $72,000-$73,000 amid growing volatility and thinning market demand.
Analysts and traders are now warning that this drop could signal deeper losses ahead, with bearish sentiment rising across technical charts and on‑chain data. With prediction markets even pricing in a chance of sub‑$65K levels this year, investors are asking one big question: is Bitcoin just correcting or entering a broader downturn?
Bitcoin Price Falls Near $70,000 Amid Bear Market Warnings
Bitcoin Today: Price Breakdown and Market Stress
The Bitcoin has slipped sharply toward the $70,000 level in early February 2026, hitting the weakest price seen since late 2024. On February 4-5, 2026, BTC broke below $75,000 and dropped to roughly $71,000-$73,000, marking a 15‑month low amid heavy selling pressure and volatility.
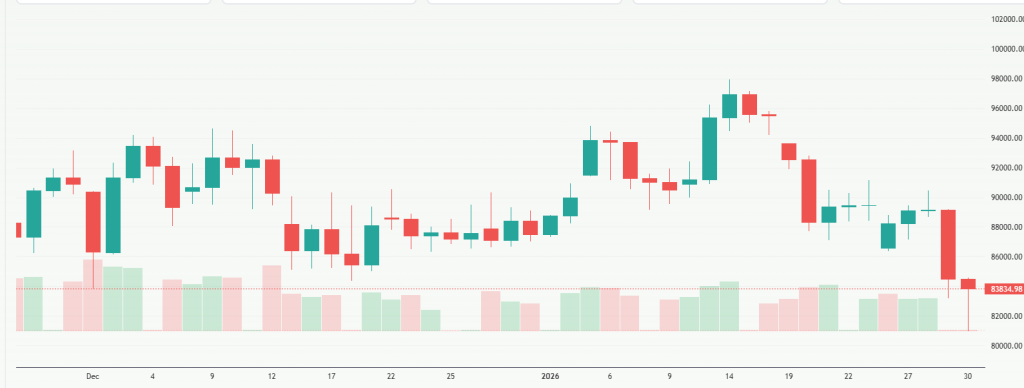
This decline has erased significant gains from previous weeks and pushed Bitcoin deeper into correction territory. Forced liquidations in futures markets have been especially severe, exceeding $800 million in recent sessions and contributing to sustained price weakness. Traders are now closely watching whether the $70,000 support zone holds or gives way to further downside.
Analysts point to weakening spot demand in the U.S. and rising exchange reserves as signs that buyers are not stepping in quickly enough. This lack of support adds to bearish sentiment and increases the risk of a further slide if near‑term technical levels continue to break.
What Technical Levels are Analysts Watching?
Why Is $70,000 So Important?
The $70,000 level is widely seen as a key support zone for Bitcoin in early 2026. Technically, this price sits near intermediate support after a breakdown of multiple trend lines and moving averages.
Some analysts use tools like AI‑assisted technical indicators to monitor price momentum and support zones, noting that a break below $70K could open space for deeper corrections. CryptoQuant identifies this zone as a crucial pivot and suggests that failure to hold it might expose BTC to further losses toward the $56,000 range, where historical bottoms have sometimes formed.
Short‑Term Resistance and Moving Averages
After losing several key support levels, Bitcoin now faces resistance bands in the $75,000-$78,000 area. Reclaiming these zones would be necessary for bullish momentum to re‑emerge. The breakdown below the 365‑day moving average on longer time frames is also considered a bearish signal, reinforcing the near‑term downtrend.
Why are Traders Warning of Bearish Trends?
Are Analysts Predicting a Bear Market?
Yes. Several market pros are warning that Bitcoin’s recent price action resembles the initial stages of a bear market rather than a short correction. CryptoQuant’s head of research has noted that liquidity and demand indicators have weakened, and intermediate support levels are vulnerable.
He suggested that BTC could revisit $70,000 within months, and deeper weakness toward $56,000 is possible if broader demand doesn’t improve. Another recent analyst report highlights a collapse in demand growth and weakening on‑chain signals, consistent with prolonged lower price ranges.
What High‑Profile Investors are Saying?
Veteran investor Michael Burry, known for predicting the 2008 financial crisis, recently warned that Bitcoin’s slide below $70,000 could trigger “sickening scenarios,” including tightened funding conditions and forced selling among corporate holders. Burry also suggested that crypto market stress may have spilled over into other asset classes, such as gold and silver, as institutions de-risked positions in late January.
Other analysts are cautioning that the sharp drops and volatility could push Bitcoin toward deeper pain points if selling pressure remains unchecked.
What are the Immediate Risks and Catalysts for Bitcoin?
Is There a Risk of Further Sell‑Off?
Yes. A break below key support levels like $70,000 could accelerate selling as leveraged traders and weak hands exit positions. Elevated exchange reserves and reduced ETF demand are seen as bearish catalysts, providing more coins available for sale and less institutional buying support. These factors, combined with broader risk‑off sentiment in traditional markets, heighten the chances of deeper declines in the near term.
Could Macro Conditions Make Things Worse?
Macro uncertainty, including shifts in global interest rates or liquidity conditions, often influences crypto markets due to risk‑asset correlation. Traders are watching for slower capital inflows or tighter financial conditions that could further undermine Bitcoin’s recovery potential. These broader economic tensions can deepen corrections beyond purely crypto‑specific factors.
Bitcoin Price: How are Different Traders Reacting?
What Short‑Term Traders are Doing?
Short‑term traders have been adjusting risk exposure and hedging against additional downside. Options markets show growing demand for protective positions, indicating expectations of a continuation of the downtrend unless certain resistance levels are convincingly reclaimed.
What Long‑Term Investors are Thinking?
Long‑term holders are divided. Some see the recent drop as a buying opportunity if price stabilizes around support. Others stress that the broader trend must show signs of improved liquidity and demand before considering accumulation. Longer‑term holders may look at macro adoption trends, ETF flows, and technological adoption before re‑engaging heavily.
Conclusion: What Comes Next for Bitcoin?
Bitcoin’s drop toward $70,000 raises questions about a bear market or deeper correction. With forced liquidations and weakening demand, downside risks are clear. If BTC holds support and reclaims resistance, a rebound is possible. Traders should watch $70,000, institutional flows, and macro trends for the next move.
Frequently Asked Questions (FAQs)
Many analysts say Bitcoin is acting like a bear market in early February 2026 because demand has dropped and price pressure is growing. BTC may test deeper lows before stabilizing.
Bitcoin could fall to $70,000 or below if buyers stay weak, ETFs sell more coins, and key supports break. Some models even see a drop toward $65,000.
Right now, support levels are around $70,000 and $72,000. Resistance sits near $78,000-$82,000. Breaking below support may push prices lower.
Disclaimer:
The content shared by Meyka AI PTY LTD is solely for research and informational purposes. Meyka is not a financial advisory service, and the information provided should not be considered investment or trading advice.
What brings you to Meyka?
Pick what interests you most and we will get you started.
I'm here to read news
Find more articles like this one
I'm here to research stocks
Ask our AI about any stock
I'm here to track my Portfolio
Get daily updates and alerts (coming March 2026)