Bitcoin Climbs to Around $68.7K as Trump’s Iran De‑escalation Comments Boost Crypto Sentiment
Bitcoin traded near $68,700 on April 1, 2026, gaining momentum after easing geopolitical fears. The rise came soon after Donald Trump signaled a possible de-escalation in tensions with Iran. Global markets reacted quickly. Stocks moved higher, while oil prices dropped, creating a risk-on environment.
Crypto followed the trend, showing how closely it now moves with macro events. Just days earlier, Bitcoin had slipped below $68K amid rising concerns about conflict. This sharp rebound raises a key question: Is Bitcoin still a haven, or is it behaving like a risk asset? Understanding this shift is important for investors tracking short-term moves and long-term trends in the crypto market.
Advertisement
Bitcoin Price Surge Explained: What Happened?
Key Price Movement – April 2026 Data
Bitcoin traded near $68,700 on April 1, 2026, gaining around 2-3% in a single day. Recent price range shows consolidation:
- Support: ~$62,500
- Resistance: ~$75,000
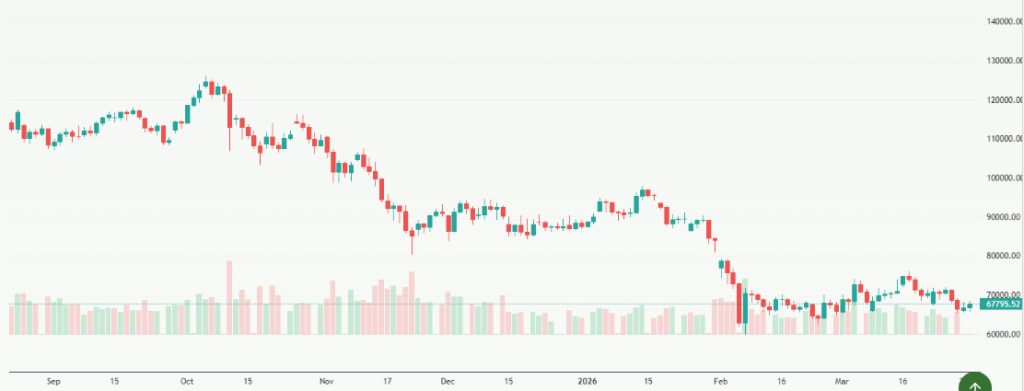
Bitcoin still trades about 8% below its recent high near $75,000. This shows a recovery phase, not a full breakout.
What triggered the rally?
The main trigger was comments from Donald Trump about easing tensions with Iran. He suggested the conflict could end within weeks. Markets reacted quickly:
- Stocks moved higher
- Oil prices dropped
- Crypto prices followed
This created a short-term “risk-on” mood across global markets.
How Geopolitics is Driving Crypto Markets in 2026?
How did the Iran conflict affect Bitcoin?
The Iran-related tensions earlier in 2026 pushed markets into uncertainty. Key impacts:
- Oil prices surged above $100
- Inflation fears increased
- Investors moved to safer assets
Bitcoin reacted in mixed ways. At times, it rose as a hedge. At other times, it fell with risk assets. This shows Bitcoin does not behave like a traditional haven.
Why did sentiment shift to “risk-on”?
Trump’s de-escalation comments reduced fear in the market. This led to:
- Falling oil prices
- Rising equity markets
- Weakening demand for safe assets
Crypto followed the same pattern. Investors started moving back into higher-risk assets like Bitcoin.
Bitcoin vs Traditional Markets: Who Reacted Stronger?
Did stocks outperform Bitcoin?
Yes, stock markets showed a stronger reaction.
This suggests that traditional markets had stronger buying pressure.
What happened to oil and gold?
Oil prices dropped sharply after the news. At one point, crude fell more than 15%. Gold behaved differently. It stayed strong, showing mixed sentiment. This highlights a key trend: Bitcoin is acting more like a tech asset than digital gold.
Market Sentiment Analysis: Is This a Sustainable Rally?
Are traders confident in this rally?
Data suggests weak conviction. Key signals:
- Trading volume increased
- Open interest stayed flat
This means short-term traders are active, not long-term investors. Such rallies often fade quickly if sentiment changes.
What are the key Bitcoin price levels now?
Important levels to watch:
- Resistance: $70,000
- Support: $62,500
If Bitcoin breaks above $70K, it could move toward $80K-$90K. If tensions return, prices may fall again.
Macro Factors to Watch Next?
Why is U.S. jobs data important for Bitcoin?
The U.S. jobs report is due on April 3, 2026. Weak data may lead to:
- Rate cut expectations
- Stronger crypto prices
Strong data may slow the rally.
How does Federal Reserve policy affect crypto?
Interest rates play a major role.
- High rates → pressure on Bitcoin
- Rate cuts → bullish for crypto
Oil price changes also impact inflation and Fed decisions.
What geopolitical risks remain?
The Iran situation is still uncertain. Any escalation could:
- Push oil prices higher
- Trigger market panic
- Cause crypto sell-off
De-escalation supports further gains.
Crypto Market Trends Beyond Bitcoin
How are altcoins performing?
Major altcoins also gained:
- Ethereum rose ~4% to ~$2,130
- Solana and XRP showed moderate growth
However, gains remain limited compared to Bitcoin.
Is the broader crypto market recovering?
The overall market trend is still weak.
- Downtrend since late 2025
- Recovery driven by macro news, not fundamentals
This suggests the rally may be temporary.
Bitcoin Price Forecast, Technical Analysis & Meyka Insights
Bitcoin Short Details / Forecast
- Current price: ~$68.7K (April 1, 2026)
- Short-term trend: Sideways to slightly bullish
- Volatility: High due to geopolitical triggers
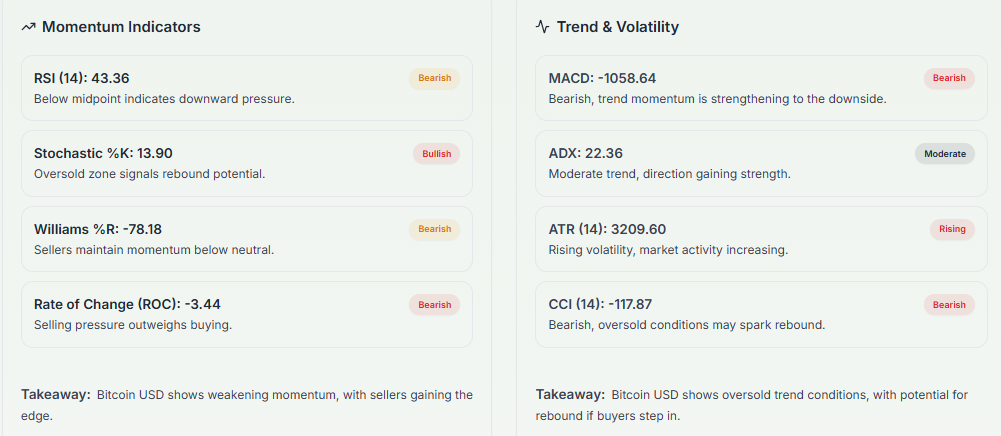
Technical Analysis Summary
- RSI: Neutral zone (no strong momentum)
- Moving averages: Price near key resistance
- Volume: Rising, but not strong enough
The market lacks a strong breakout confirmation.
What Meyka Says?
According to insights from Meyka, Bitcoin is in a macro-driven cycle.
- Short-term: Sentiment-led movements
- Long-term: Dependent on institutional flows
Meyka’s AI stock analysis tool highlights weak conviction in derivatives, signaling caution.
Supporting Analyst Insights
- FXStreet: Rally shows weak conviction
- Barron’s: Crypto reacting like equities
- Reuters: Markets driven by geopolitical easing
These views align with a cautious outlook.
Wrap Up
Bitcoin’s recent move toward $68.7K reflects how strongly crypto now reacts to global events. The rally is driven by easing geopolitical tensions, not strong fundamentals. Market signals show caution, with weak conviction among traders. Future price direction depends on U.S. economic data and Iran developments. Investors should stay alert, as sentiment can shift quickly in this macro-driven environment.
Disclaimer:
The content shared by Meyka AI PTY LTD is solely for research and informational purposes. Meyka is not a financial advisory service, and the information provided should not be considered investment or trading advice.
Advertisement
What brings you to Meyka?
Pick what interests you most and we will get you started.
I'm here to read news
Find more articles like this one
I'm here to research stocks
Ask our AI about any stock
I'm here to track my Portfolio
Get daily updates and alerts (coming March 2026)