


Bitcoin (BTC-USD) is trading near $76,000 in early February 2026, marking one of its weakest phases in recent months. The world’s largest cryptocurrency has slipped well below the $80,000 mark as selling pressure builds across global markets. This move comes amid tighter liquidity, shifting investor sentiment, and renewed caution toward risk assets. Trading volumes remain high, but confidence looks fragile. Several short-term rallies have failed, signaling that buyers are still hesitant to step in aggressively.
For investors and traders, this price action is more than a routine dip. It reflects deeper changes in how the market is reacting to macro signals and technical stress. With key support levels now in focus, Bitcoin’s next move could shape broader crypto trends in the weeks ahead.
Latest Bitcoin Price Action & Market Data
Bitcoin Today: Where Price Stands
Bitcoin (BTC-USD) is trading near $76,000-$78,000 in early February 2026, marking its lowest levels since April 2025. This sharp slide pushed prices down over the weekend, triggering heavy selling and market liquidations. Data from major trackers show Bitcoin dipping below $80,000 on January 31, 2026, and remaining under pressure as investor sentiment cools.
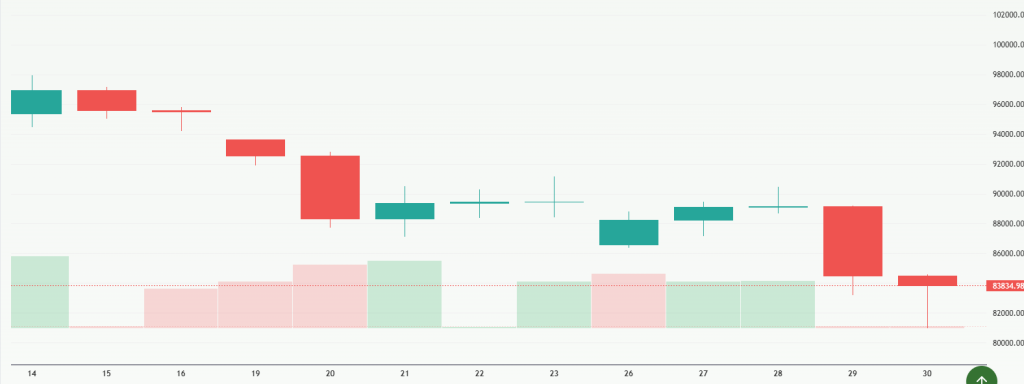
This recent weakness comes after Bitcoin dropped nearly 7% in one session, its biggest one-day loss since March 2025, and the broader crypto market saw roughly $2.5 billion in liquidations. Many traders are now watching the $73,000 – $74,500 range as a critical technical support zone.
Bitcoin’s market cap has fallen, with trading volumes still high but momentum clearly tilted toward sellers. It’s also marking its fourth straight month of losses, which underscores a sustained downtrend rather than a short dip.
Support & Resistance Levels: Key Charts
- Support levels: ~$74,500 (April 2025 lows), ~$73,000
- Resistance levels: ~$79,000-$80,000 (recent failed breakout point)
- Price trading below the “true market mean” of ~$80,700, seen as a key cost-basis level for many holders.
These levels will shape short-term price action and help determine whether Bitcoin breaks out of its downtrend or continues sliding.
Why Bitcoin Is Down, Market Drivers & Indicators?
What Macro Forces are Pressuring Bitcoin?
Bitcoin’s recent slide is linked to broader market trends and macroeconomic shifts. The nomination of Kevin Warsh as the next Federal Reserve Chair injected fears of tighter financial conditions, as markets view him as potentially hawkish. This pushed traders to rethink risk assets, including crypto.
In addition, markets have been hit by risk-off flows. Precious metals such as gold and silver crashed sharply last week, erasing trillions in value, while U.S. stock futures weakened, dragging sentiment lower across asset classes. The stronger U.S. dollar and inflation concerns also made non-yielding assets like Bitcoin less attractive.
Put simply, Bitcoin is reacting more like a risk asset tied to speculation than a safe haven, which has deepened its sell-off as investors seek shelter in cash or traditional markets.
Are On-Chain and Technical Signals Bearish?
Yes. On-chain data and technical setups show rising selling pressure. In late January, BTC briefly traded below its “true market mean” cost-basis level (~$80.7K). This signals that many holders are underwater and may exit positions.
Liquidations of leveraged positions were also significant, contributing to downward momentum. Overall, both macro and technical forces are nudging Bitcoin into a broader downtrend rather than just a short correction.
Bitcoin vs. Traditional Markets
How Does Bitcoin Compare With Stocks & Risk Assets?
Bitcoin’s price moves have shown increasing correlation with other risk assets. As U.S. stock futures fell sharply following drops in gold and silver, Bitcoin also slid, indicating shared market pressures. Traditional equities and crypto often react in tandem during risk-off periods, especially when macro uncertainty rises.
Is Bitcoin Still a Safe Haven Compared to Gold?
No. Despite early narratives positioning Bitcoin as “digital gold,” recent price action suggests it behaves more like a speculative risk asset. While gold initially rallied to multi-year highs amid global uncertainty, Bitcoin did not attract safe-haven flows and instead declined alongside risk assets.
This shift has led analysts to question Bitcoin’s role as a crisis hedge. Instead, it has tracked broader market sentiment, increasing downside risk during volatility. This comparison helps explain why Bitcoin’s weakness feels more like equity sell-offs than a haven break.
What Traders & Investors Should Watch Next?
Which Levels are Key for Bitcoin’s Next Move?
Traders should watch $73,000 – $74,500 as key support levels this week. If Bitcoin breaks below these zones on strong volume, it could signal deeper downside. Conversely, reclaiming $79,000 – $80,000 convincingly would be the first sign of renewed bullish interest.
What Data & Events Matter?
Short-term catalysts include:
- Federal Reserve comments and liquidity outlook
- Inflation data releases
- Macro risk sentiment indicators
- Crypto market liquidations and funding rates
Institutions using AI stock analysis tools are increasingly adding macro signals to crypto forecasts, enhancing predictions for turning points in BTC prices.
Sentiment & Technical Signals to Watch
Look for a shift in:
- Funding rates turning positive
- Increasing volume on green candles
- Price closing above key moving averages
These could suggest a trend reversal rather than just consolidation.
Final Words
Bitcoin’s drop to around $76,000 in February 2026 highlights its sensitivity to macro trends and market sentiment. Key support near $73K-$74.5K will determine if BTC stabilizes or dips further. Traders should watch resistance at $79K-$80K, macro updates, and on‑chain signals for signs of recovery or continued downtrend.
Frequently Asked Questions (FAQs)
Bitcoin is dropping in early February 2026 due to tight money, risk-off markets, and Fed policy fears. Investors are cautious, and many traders are selling positions, causing prices to fall.
As of February 2026, Bitcoin’s main support levels are near $73,000-$74,500. These prices may slow down further decline if buyers step in at these zones.
Bitcoin may try to rise above $80,000, but it depends on market confidence, macro news, and trading volume. Short-term rallies could happen, yet risk of decline remains.
Disclaimer:
The content shared by Meyka AI PTY LTD is solely for research and informational purposes. Meyka is not a financial advisory service, and the information provided should not be considered investment or trading advice.
What brings you to Meyka?
Pick what interests you most and we will get you started.
I'm here to read news
Find more articles like this one
I'm here to research stocks
Ask our AI about any stock
I'm here to track my Portfolio
Get daily updates and alerts (coming March 2026)