


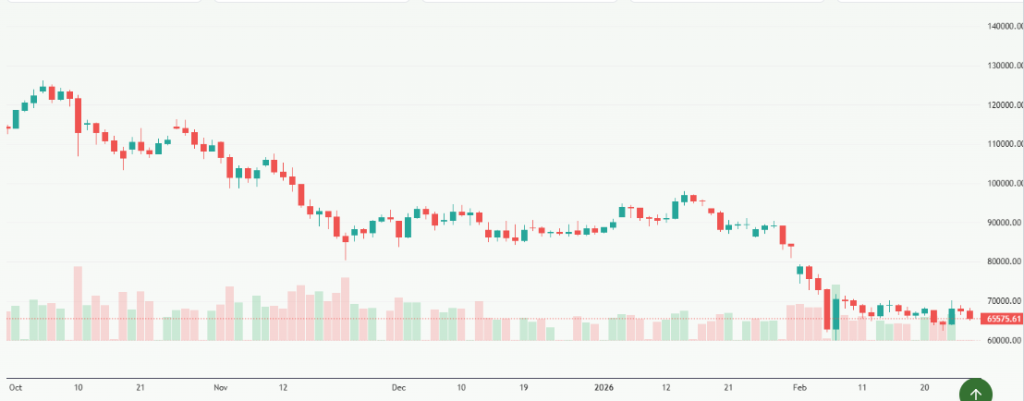
Bitcoin dipped sharply below $67,000 in late February and early March 2026, as a sudden leap in Middle East tensions rocked global markets and crypto sentiment. Traders reacted quickly when U.S. and Israeli military strikes against Iran triggered fear across risk assets, pushing BTC down toward $63,000 before bouncing back modestly. This move marked one of the most volatile weekend sessions in recent months for the world’s largest cryptocurrency.
Risk‑off trading is evident, with investors digesting shifting geopolitical headlines and weighing the fallout. In this blog, we unpack what’s driving the drop, what it means for Bitcoin’s market structure, and where BTC might head next.
Bitcoin Price Movement & Key Data
Recent global news has hammered Bitcoin’s price. On March 1, 2026, BTC briefly slipped below $67,000 after sharp weekend volatility tied to geopolitical events. Data shows the world’s largest cryptocurrency hit lows near $63,000 before modest recovery attempts earlier this week.
Markets reacted violently after joint U.S.-Israel strikes on Iran and reports of Iranian leadership casualties. This triggered risk‑off sentiment in crypto and traditional markets alike. Prices across digital assets dropped, wiping out billions in market value and showing Bitcoin’s growing correlation with broader risk assets.
In Asian and European sessions, BTC traded around $66,000 to $67,000, still below recent peaks. Ethereum and major altcoins also showed weakness, reinforcing the market‑wide sell‑off pattern.
Geopolitical Tension & Market Psychology Impact on Bitcoin
What is driving Bitcoin’s recent slump?
Bitcoin’s recent slip isn’t due to crypto factors alone. It’s tied to escalating tensions in the Middle East, especially between Iran, the United States, and Israel. Over the weekend, major strikes in Iran and subsequent retaliation caused shockwaves across financial markets.
Investors reacted by selling riskier assets, including Bitcoin. Safe‑haven flows pushed gold and traditional bonds higher, while BTC lost ground instead of acting as a “crisis hedge.”
Why are markets reacting this way?
Traditionally, Bitcoin’s narrative has been digital gold, a safe store during turmoil. Recent moves show a different reality. When geopolitical risk spiked, traders treated BTC like a risk asset. This means BTC fell alongside stocks and was sold to raise cash and reduce exposure.
Analysts also point to forced liquidations as traders on leverage were stopped out. Derivatives market data indicate that funding rates plunged. This underscores the fear and bearish sentiment gripping crypto markets in the near term.
Bitcoin: Technical and Fundamental Factors
What technical levels should traders watch?
Bitcoin’s price structure shows key support zones in the $60,000 to $63,000 range. Breaking below this could signal deeper losses. Resistance remains near $68,000 to $70,000.
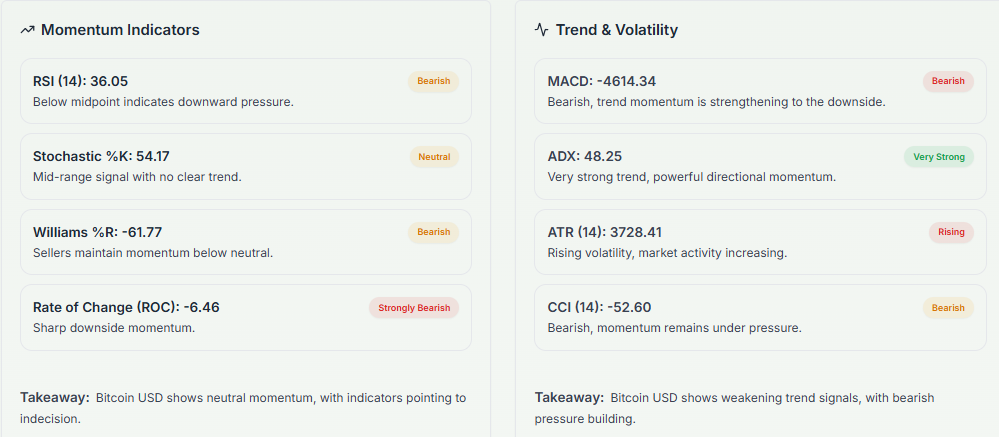
Short‑term price swings are amplified by low weekend liquidity and elevated volatility. This means large moves can occur quickly when news hits outside normal trading hours.
What fundamental forces matter now?
Beyond geopolitics, macro drivers like U.S. interest rates, tariff policy, and risk sentiment shape BTC’s path. Recent Federal Reserve guidance and economic data influence market risk appetite, indirectly pressuring Bitcoin along with equities.
Investors must also watch traditional safe‑haven assets such as gold. Bullish action there typically coincides with BTC weakness during global risk spikes.
Implications for Traders & Investors
How should investors think about Bitcoin risk now?
Bitcoin’s drop shows that in times of geopolitical stress, BTC trades more like a risk asset than a safe haven. This dynamic matters for portfolio positioning.
Traders should consider:
- Watching $63K support levels closely for trend direction.
- Avoiding excessive leverage until volatility subsides.
- Monitoring oil, gold, and FX markets as proxies for risk sentiment.
- Using AI stock analysis tools and crypto sentiment models to gauge abrupt market swings.
Understanding these dynamics helps investors manage risk and align strategy with broader market behavior.
Wrap Up
Bitcoin’s recent slip below $67,000 shows how geopolitical risk and market psychology now play a big role in crypto pricing. The latest sell‑offs underline that Bitcoin behaves much like other risk assets under stress, not always as a safe haven.
Traders should stay alert on key support zones, watch traditional markets for signals, and prepare for more volatility as global events unfold. Continued close monitoring and disciplined risk management remain essential in this uncertain environment.
Frequently Asked Questions (FAQs)
Why did Bitcoin (BTC) drop below $67,000?
Bitcoin fell under $67,000 in late February 2026 as traders sold on rising global risks. Heavy selling followed U.S. and Israel strikes on Iran and risk‑off sentiment in markets. BTC slid toward $63,000 before a small rebound.
Is Bitcoin acting like a safe‑haven during the Iran conflict?
In early March 2026, Bitcoin behaved more like a risk asset than a haven. When Iran conflict fears rose, BTC fell with stocks, while gold and safe‑haven currencies gained.
What price levels should BTC investors watch now?
Investors are watching support near $60,000-$63,000 and resistance around $68,000-$70,000. Breaking key levels can signal further moves or rebounds.
Disclaimer: The content shared by Meyka AI PTY LTD is solely for research and informational purposes. Meyka is not a financial advisory service, and the information provided should not be considered investment or trading advice.
What brings you to Meyka?
Pick what interests you most and we will get you started.
I'm here to read news
Find more articles like this one
I'm here to research stocks
Ask our AI about any stock
I'm here to track my Portfolio
Get daily updates and alerts (coming March 2026)