


On March 19, 2026, Bitcoin took a sharp turn lower as traders reacted to fresh signals from the U.S. Federal Reserve that fewer interest rate cuts are likely this year. BTC briefly dipped under $70,000, wiping out recent gains and shaking confidence across crypto markets. This shift in the Fed’s outlook caught many off guard and sparked a broader sell‑off in risk assets.
For years, Bitcoin has closely tracked investor expectations of easing monetary policy, so this new “higher for longer” stance has real consequences for crypto prices and trader sentiment. Let’s unpack what changed and why it matters for Bitcoin now.
Bitcoin Price Today: Key Moves After Fed’s 2026 Rate Outlook Shift
Bitcoin has slid sharply after a major macro development on March 19, 2026. The U.S. Federal Reserve held interest rates steady at 3.50-3.75% but signaled that rate cuts this year will be fewer than markets expected. This “higher‑for‑longer” tone weakened risk assets, including cryptocurrencies.
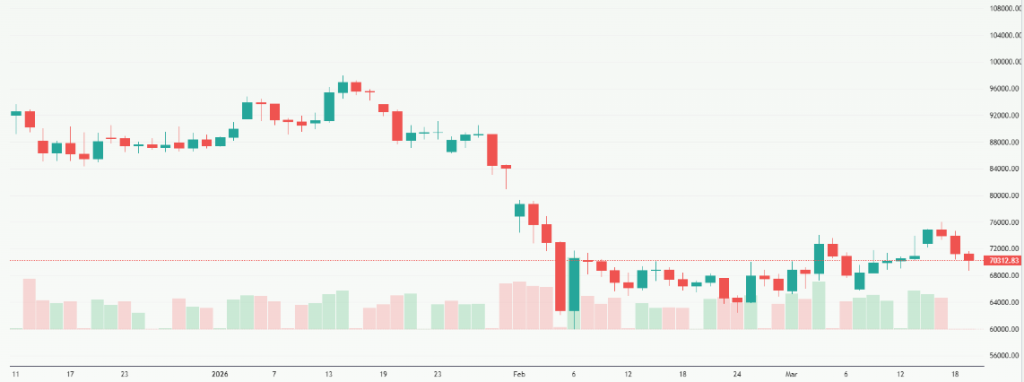
On the same day, Bitcoin dropped around 4-5.5%, dipping below $70,000 before modest rebounds. Prices were trading in the $69,000-$71,000 range as sentiment cooled. Broader crypto markets also felt the impact. Major tokens like Ethereum and XRP posted larger percentage losses than BTC, reflecting risk‑off flows.
This recent move shows how sensitive BTC has become to macroeconomic signals. When the Fed signals less easing ahead, liquidity expectations tighten, and risk‑taking declines. That often means lower demand for volatile assets.
Short‑term traders are watching whether the $70,000 support level holds. If it doesn’t, technical sellers could push BTC toward lower bands like $68,000-$69,000. Market activity and order flow suggest caution.
This slump follows a week in which Bitcoin had been oscillating around the $70K mark amid mixed economic data and energy price pressures that complicate inflation outlooks.
How Does the Fed’s 2026 Outlook Affect Bitcoin?
What Did the Fed Actually Say?
At its March 2026 policy meeting, the Federal Open Market Committee left the federal funds rate unchanged. However, the updated dot plot showed far fewer expected rate cuts this year than traders had priced in. Some projections even show zero cuts in 2026.
That shift has big implications. Bitcoin and other risk assets rally when traders expect looser monetary policy. When the Fed signals restraint, those gains can reverse quickly.
Why Does This Matter for Bitcoin?
- Stable or rising rates reduce future liquidity.
- Higher expected yields on bonds make risk‑free assets more attractive.
- Fewer rate cuts squeeze capital available for non‑traditional assets like BTC.
In short, investors see slower easing as a reason to move capital out of speculative markets.
How are Traders Interpreting the Signal?
Markets now reflect much lower odds of Fed easing in 2026. The CME FedWatch tool shows near‑zero probability of cuts this year. That’s a stark contrast to earlier forecasts.
Some strategists still argue multiple cuts could come later if data softens, but most traders are pricing caution. This macro narrative now plays a central role in short‑term BTC price moves.
Where are the support and Resistance Levels for BTC now?
What Technical Levels are Traders Watching?
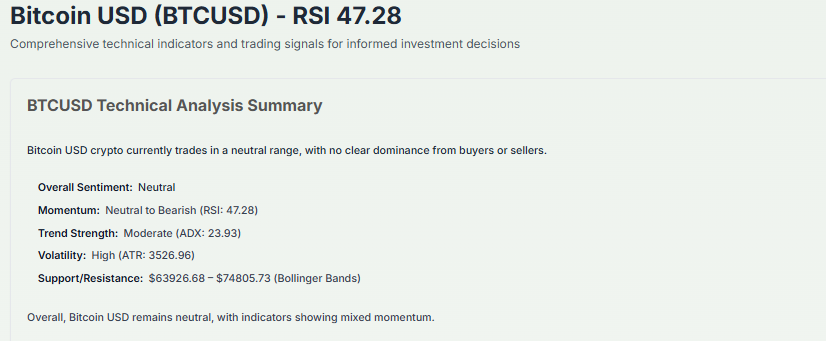
Bitcoin’s price has been fluctuating in a tight range since the Fed announcement. Many chart watchers identify $70,000 as a key psychological support point. Breaches below this level could open the door to deeper corrections.
Major resistance levels appear around $73,000-$75,000, where selling interest has historically increased. If Bitcoin can climb above that zone with strong volume, it may spark renewed bullish momentum.
What Do Short‑Term Charts Suggest?
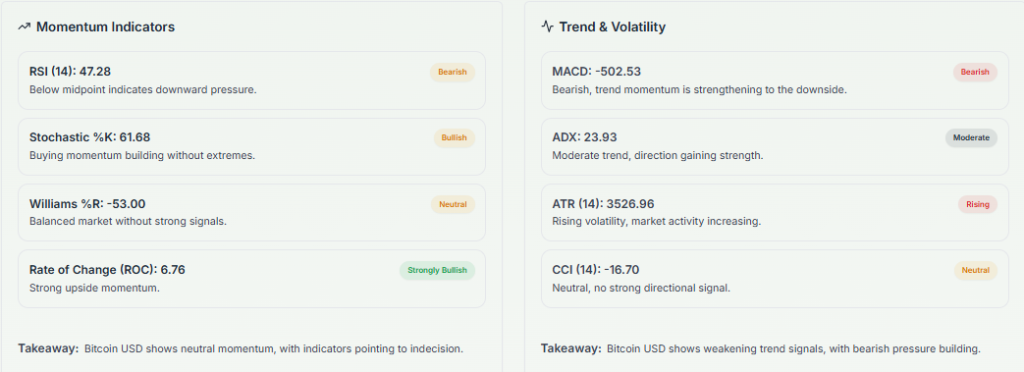
Technical indicators show tightening price action and fading volume, which often signals indecision or a pending breakout. If BTC breaks support on high volume, the next downside could be around $68,000-$69,000. Conversely, reclaiming key resistance could send the price toward higher targets.
Sentiment and Market Structure
On social and trading forums, sentiment near the current price band remains cautious. Some traders point to accumulation at support as a sign that the downside may be limited. Others focus on macro flows and liquidity as the main drivers in the short term.
AI‑powered tools that analyze order books and liquidity trends also show a cooling in long exposure, reinforcing the view that markets await a clearer macro catalyst.
What are Analysts Forecasting Next for BTC?
Bearish and Bullish Views
Analysts now present a wide range of forecasts for Bitcoin in 2026. Some see continued volatility if inflation remains persistent and rate cuts stay off the table. This “macro‑driven” environment could hold BTC under pressure.
Other analysts note that macro headwinds often create buying opportunities for long‑term holders. Past cycles show BTC can rebound sharply after periods of consolidation, but timing varies widely.
Institutional and Regulatory Factors
Citigroup recently lowered its 12‑month BTC target from $143,000 to $112,000, citing stalled crypto regulation in the U.S. This reflects slower institutional tailwinds and slower ETF growth.
Regulatory development, ETF flows, and legislative clarity remain major drivers beyond macro signals. These could change supply‑demand dynamics for Bitcoin.
Macro Inflation and Geopolitical Risks
Inflation data and energy price trends are key. Oil price surges tied to Middle East tensions have worsened inflation expectations, indirectly pressuring BTC.
If inflation cooldowns appear, markets might reprice rate paths and boost risk assets. Until then, Bitcoin’s price will likely remain sensitive to central bank guidance.
What to Watch Next in BTC Markets?
Key Data Events Ahead
Investors should watch the following:
- Upcoming U.S. inflation reports (CPI, PPI)
- Next Fed meeting minutes and press commentary
- Oil price trends and global energy developments
These will shape macro expectations and liquidity conditions.
Market Flow Indicators
- ETF inflows/outflows
- Volume trends on major exchanges
- Futures open interest shifts
These help indicate risk appetite among institutions and traders.
Risk Factors for Bitcoin
Ongoing geopolitical risk, sticky inflation, and weak economic data could keep rate cuts off the table. Continued macro uncertainty is likely to keep Bitcoin in a choppy range.
If inflation cools unexpectedly, markets could rethink the rate path. That might spark upside for BTC. For traders, confirming a break above key resistance or a breakdown below support will help define the next trend.
Wrap Up
Bitcoin’s drop below $70,000 after the Fed’s 2026 outlook highlights how sensitive BTC is to macro shifts. Traders now watch inflation, rate signals, and liquidity closely. Short-term moves depend on whether key support or resistance levels hold. Market caution is high, but any easing in economic pressures could quickly revive Bitcoin’s momentum.
Frequently Asked Questions (FAQs)
Bitcoin fell below $70,000 on March 19, 2026, as the Fed signaled fewer rate cuts, reducing market risk appetite.
BTC key support is $70,000, with resistance near $73,000-$75,000, guiding traders on potential short-term price moves in 2026.
Fewer rate cuts tighten liquidity, lower risk appetite, and can push Bitcoin and other crypto prices down in March 2026.
Disclaimer:
The content shared by Meyka AI PTY LTD is solely for research and informational purposes. Meyka is not a financial advisory service, and the information provided should not be considered investment or trading advice.
What brings you to Meyka?
Pick what interests you most and we will get you started.
I'm here to read news
Find more articles like this one
I'm here to research stocks
Ask our AI about any stock
I'm here to track my Portfolio
Get daily updates and alerts (coming March 2026)