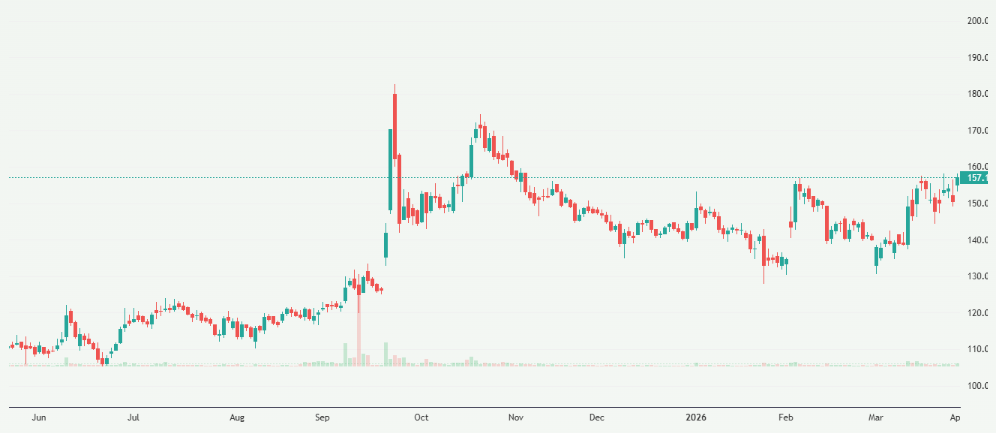
On April 2, 2026, Adani Power Ltd saw its share price slide sharply during trading, hitting an intraday low of ₹151.45 amid intensified selling pressure across markets. The stock closed the day down about 3.12%, lagging broader market indices under heavy pressure amid weak sentiment and volatility.
Investors watched closely as this slump unfolded, coming after a recent period of mixed performance and broader swings in the power sector. With the benchmark Sensex struggling and other large‑caps also retreating, Adani Power’s drop reflects both market‑wide headwinds and stock‑specific reactions.
Advertisement
This movement raises important questions for traders and long‑term holders alike. Let’s explore what triggered today’s fall and what it could mean for the road ahead.
Market Snapshot: How Adani Power Performed?
On April 2, 2026, Adani Power Ltd shares came under clear selling pressure. The stock hit an intraday low of ₹151.45, ending the session lower by about 3.12% on heavy market volatility and weak broader indices. This move was sharper than the overall market decline, with the Sensex slipping around 1.86%, trading near a 52‑week low, and staying below its 50‑day moving average, a technical sign of bearish market sentiment.
Here’s how the session unfolded:
- Intraday range: Heavy swings throughout the trading day, with volatility roughly measured at ~38.6% based on weighted average price.
- Benchmark impact: The Sensex’s sustained decline over three straight weeks contributed to selling pressure across large‑caps, including Adani Power.
- Technical backdrop: Despite the short‑term drop, Adani Power’s price remained above many medium‑ and long‑term averages (like its 20‑, 50‑, and 200‑day moving averages), suggesting a mixed technical picture. Weekly and monthly indicators such as MACD and Bollinger Bands remained constructive, but momentum metrics like RSI and Dow Theory signals were currently neutral.
This price action shows that short‑term bearish sentiment dominated the session, even though broader technical supports remain intact. Traders reacted strongly to wider market cues rather than company‑specific news on the day.
In short, on April 2, Adani Power fell more than the broader market. It showed heightened volatility and risk aversion among traders, weighed down by weak Sensex performance and declining investor confidence in short‑term price moves.
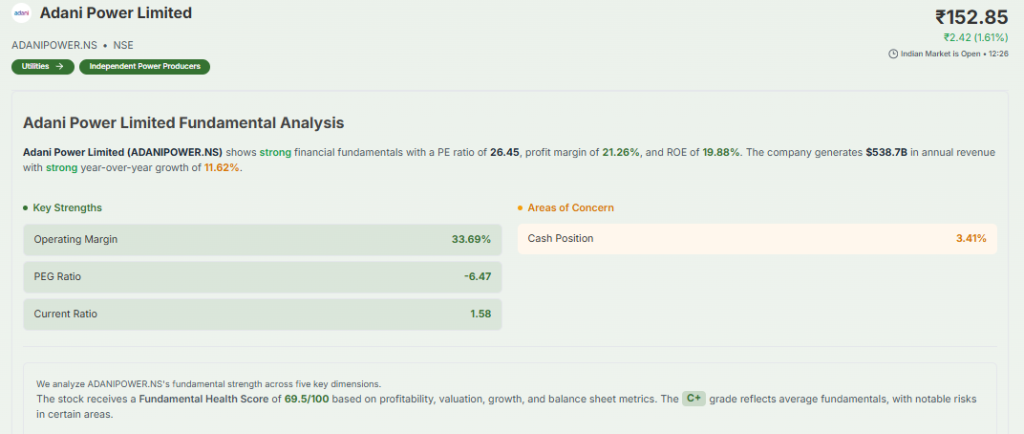
What Meyka & Technical Tools Say: Stock Details & Outlook
Meyka is a high‑authority market analysis platform that uses real‑time data and machine learning insights:
Meyka Stock Forecast & Price Targets
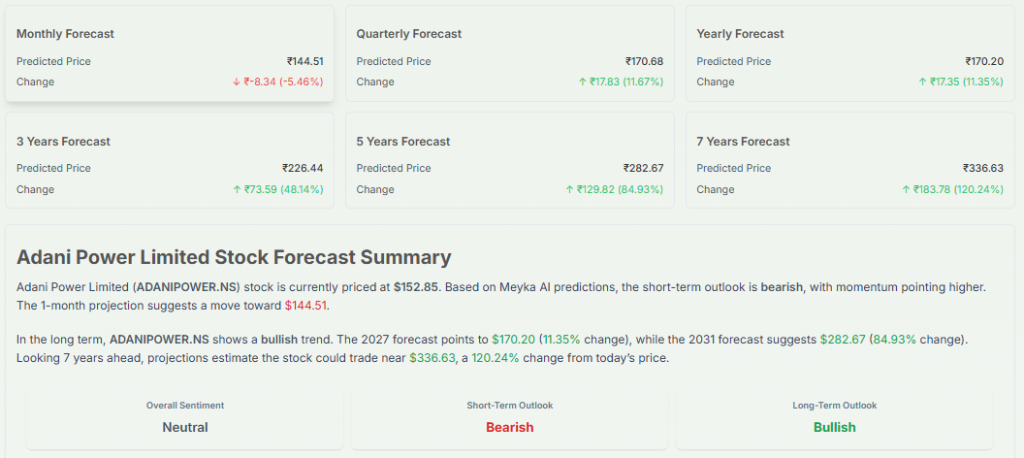
- Meyka’s AI forecast suggests that by 2026, Adani Power’s stock could potentially trade near ₹170.20, implying a bullish tilt and possible upside from current levels.
- Longer‑term AI projections from Meyka indicate positive growth into 2030, with an average projected price around $282.67, which would represent a substantial increase over time if achieved.
These AI‑based forecasts are model outputs that reflect historical price action, sector trends, and macro drivers, not investment advice.
Technical Indicators via Meyka
Meyka’s technical analysis framework shows a neutral to slightly bearish bias at present:
- Momentum indicators like RSI below the midpoint suggest mild downward pressure.
- Volatility is moderate, and the price is trading within support and resistance bands, indicating consolidation.
- On‑Balance Volume and Vigor indicators point to selling pressure outweighing buying interest in the short term.
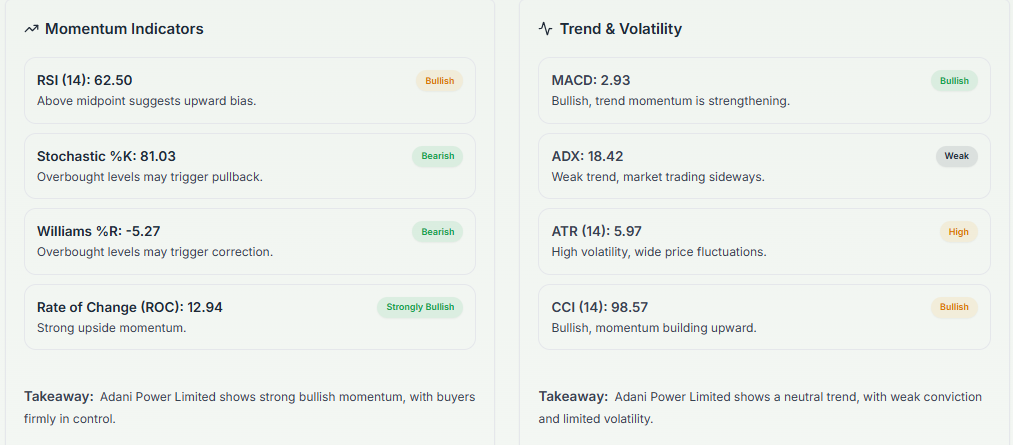
Overall, the technical structure lacks a strong trending signal, but it does not indicate a full breakdown either; rather, a range‑bound phase with bearish momentum building up in recent sessions.
Supporting Analyst Views
- Independent analyst consensus data, Investing.com shows a 12‑month average price target near ₹181.43. This reflect cautious optimism among brokers with a possible +15% upside from current levels.
- Other analyst forecasts point to modest upside potential, underlining a neutral‑to‑bullish long‑term view despite near‑term volatility.
Together, these insights suggest that Adani Power shares may stabilize before showing stronger directional moves, especially if sector sentiment improves and demand fundamentals remain intact.
Why are Adani Power Shares Falling?
1. Market‑Wide Weakness:
The broader Indian markets, including major indices like the Sensex, were in a bearish phase around early April 2026. The Sensex’s fall below its 50‑day moving average created a risk‑off environment, which pressured heavyweight stocks like Adani Power.
2. Technical Selling Pressure:
While medium‑ and long‑term indicators remain supportive, short‑term technical signals such as rising volatility and lower momentum pushed traders to take profits or cut positions. This is typical in downtrend pullbacks when key averages are breached intraday.
3. Sector Sentiment Headwinds:
The broader Power sector has faced mixed performance, with both conventional and renewable peers under pressure. Market sentiment was weighed down by cyclical concerns such as fuel cost inflation and regulatory uncertainties affecting billing tariffs and profitability.
4. Broader Adani Group News Flow:
Wider Adani Group news cycles, including previous legal and regulatory headlines, have historically influenced group stock volatility. While not directly tied to April 2 price action, lingering risk perception can tighten investor risk appetite.
5. Short‑Term Profit Booking:
After recent rallies and relative outperformance in 2025, traders could be booking gains ahead of earnings events or macro releases. Short‑term corrections often follow strong rallies even in fundamentally sound stocks.
In summary, selling pressure on Adani Power was primarily driven by market sentiment, technical triggers, and short‑term profit booking, rather than a single company‑specific event. The ongoing performance signals a need for patience from investors if broader market conditions remain uncertain.
What Analysts & Experts Expect for Adani Power Stock?
Wall Street and brokerage analysts provide additional context on future prospects:
Analyst Price Targets:
- According to recent consensus data, the average 12‑month price target for Adani Power sits around ₹181.43, with estimates ranging from ~₹173 to ~₹187, hinting at moderate upside in the next year.
- Other independent forecasts also support the view of gradual recovery and gains as earnings trends improve.
Bullish Long‑Term Views:
Some brokers like Antique Stock Broking have initiated positive coverage on Adani Power, projecting potential rallies up to about 30%, driven by capacity expansion and stable power purchase agreements.
Growth Fundamentals:
Independent forecasts and financial models expect above‑average growth in earnings and revenue over the coming years, with EPS and income expected to expand due to rising power demand in India.
Experts emphasise that volatility around broader market cues often creates short‑term price swings even in fundamentally solid names like Adani Power. Combining technical signals, analyst targets, and AI forecast outputs gives a well‑rounded outlook indicating that the longer‑term trend still leans neutral to mildly positive, but short‑term caution prevails.
Investor Takeaways & What to Watch Next?
1. Watch Key Support Levels:
Important technical supports, as highlighted by both Meyka and other platforms, sit near the lower end of recent trading ranges. A break below these could signal deeper weakness, while holds may attract buyers.
2. Broader Market Mood:
Adani Power’s performance is tied to the overall Indian market sentiment. Strength in the Sensex and sector indices could limit further downside.
3. Earnings & Power Sector Metrics:
Upcoming quarterly results and tariff updates could be catalysts for renewed interest, especially if margins improve. Macro conditions like coal prices also matter.
4. Use Tools Wisely:
Leveraging an AI stock analysis tool for pattern insights and momentum scans can help traders identify entry/exit zones with greater clarity. Short‑term investors should stay alert to price breaks and volumes, while long‑term holders may benefit from focusing on structural growth trends.
Final Words
Adani Power’s drop to ₹151.45 on April 2, 2026, reflects short-term market volatility rather than fundamental weakness. Traders faced selling pressure amid weak Sensex performance, while long-term investors can focus on steady growth trends and supportive technical levels. Monitoring key supports, sector cues, and upcoming earnings will be crucial to gauge the stock’s next move.
Advertisement
Frequently Asked Questions (FAQs)
Adani Power shares fell 3.12% on April 2, 2026, due to weak Sensex, market volatility, and short-term profit booking.
After the April 2, 2026, drop, investors may watch carefully. Short-term risk exists, while long-term growth could remain stable.
Analysts on April 2, 2026, suggest cautious optimism. Long-term trends are positive, but short-term volatility and market pressures remain high.
Disclaimer:
The content shared by Meyka AI PTY LTD is solely for research and informational purposes. Meyka is not a financial advisory service, and the information provided should not be considered investment or trading advice.
Advertisement
What brings you to Meyka?
Pick what interests you most and we will get you started.
I'm here to read news
Find more articles like this one
I'm here to research stocks
Ask our AI about any stock
I'm here to track my Portfolio
Get daily updates and alerts (coming March 2026)