Trading can feel like a puzzle, right? Charts go up, charts go down. But how do we know what comes next? So, we use chart patterns for that purpose. They help us spot opportunities before they happen. Think of them like a secret code the market leaves behind.
Trading Chart patterns are just as important as ever in 2025 and will remain important for Forex, stocks, futures, and crypto trading. We discuss the 10 best trading chart patterns in this blog post.
10 Best Trading Chart Patterns for Investors in 2025
Below are the important trading chart patterns every investor should know:
Falling Wedge
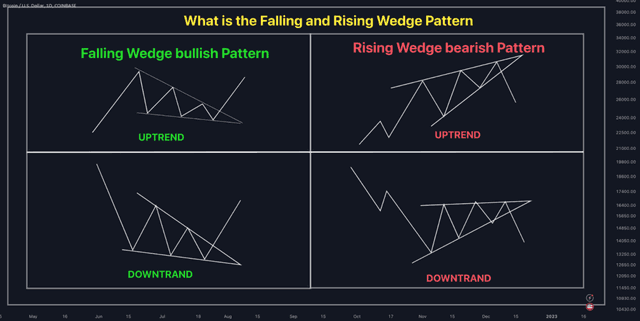
The falling wedge appears at the end of a downtrend. It signals a possible price reversal. We form this pattern when the market shows lower highs and lower lows, and two trend lines move closer together. When the price breaks above the trend line, it means momentum is shifting upward. Traders buy after the breakout candle and place a stop loss below the last low. This setup offers a great risk-to-reward trade.
Engulfing Pattern
The engulfing pattern is easy to spot. It happens often, making it a great choice for quick trades. There are two types: bullish and bearish.
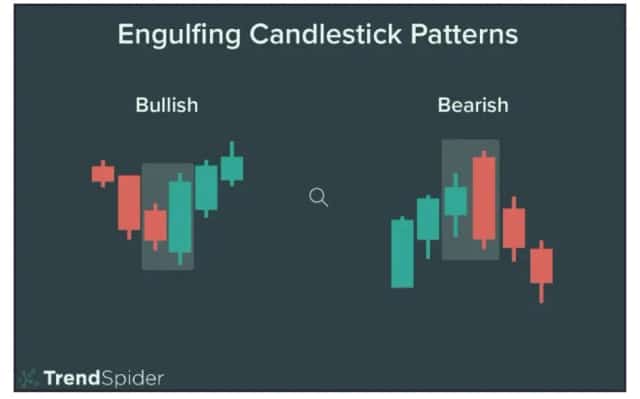
Bearish: A bearish engulfing pattern happens when a small bullish candle is followed by a large bearish candle that completely covers it. This signals a downtrend. Traders sell at the next candle’s opening and set a stop loss above the engulfing candle.
Bullish: A bullish engulfing pattern is the opposite. A small bearish candle is followed by a large bullish candle that swallows it. This signals an uptrend. Traders buy at the breakout and set a stop loss below the engulfing candle. These patterns are useful for short-term trading.
Bull Pennant
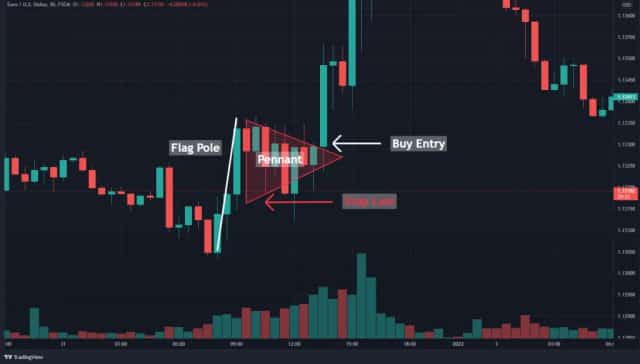
The bull pennant is a continuation pattern. We form it after a strong uptrend, followed by a short period of consolidation. This creates a small triangular shape known as a pennant. Traders buy when the price breaks above the pennant’s resistance. A stop loss goes below the pennant’s low. This setup often leads to strong price moves, making it a powerful pattern.
Bull Flag
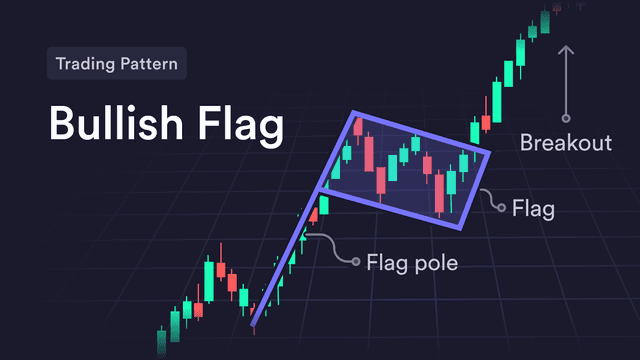
Bull flags also appear in strong uptrends. We form a bull flag when a stock or currency moves up sharply and then enters a small downward channel. The flag represents a pause before another upward move.
Traders look for a breakout candle above the flag. They enter a buy position and place a stop loss below the flag’s low. A good risk-to-reward ratio makes this pattern a favorite among traders.
Hanging Man
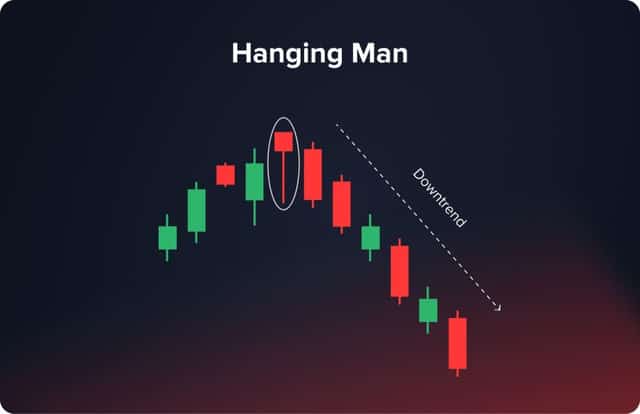
The hanging man signals the end of an uptrend. We form this pattern when a candle has a small body, a long lower wick, and little to no upper wick.
Traders sell when the next candle moves below the hanging man’s low. A stop loss is set above the high of the hanging man. This pattern suggests a shift in momentum from buyers to sellers, making it useful for identifying reversals.
Bullish Harami
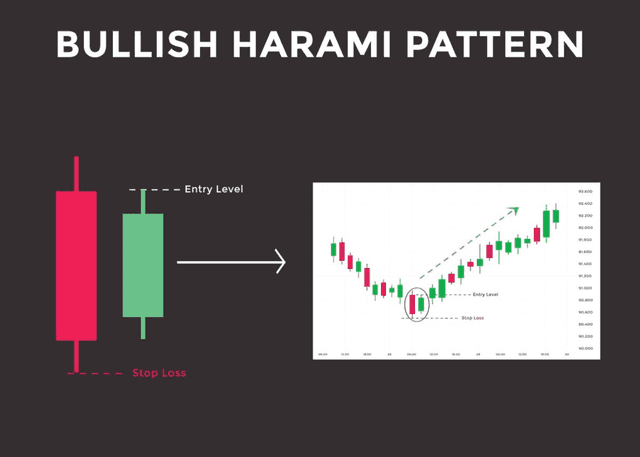
The bullish harami signals a reversal in a downtrend. We form it when a large bearish candle is followed by a smaller bullish candle inside the previous one.
Traders use indicators like the RSI to confirm the reversal. If the RSI shows a bullish crossover, traders buy after the second candle closes. A stop loss is placed below the bullish candle’s low. This pattern works well when combined with other technical tools.
Ascending Triangle
The ascending triangle is a strong continuation pattern. We form it when the price creates higher lows while hitting the same resistance level.
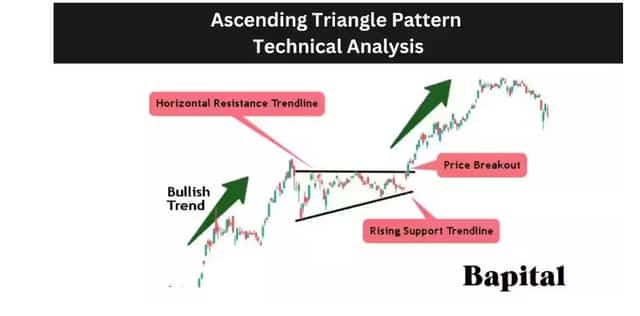
Traders wait for the breakout above the resistance line. They buy when the price moves above the triangle with strong volume. A stop loss is placed below the triangle’s lower trendline. This setup often leads to a significant price rally.
Symmetrical Triangle
The symmetrical triangle shows a period of consolidation. We form this pattern when the market makes lower highs and higher lows, creating a triangle shape.
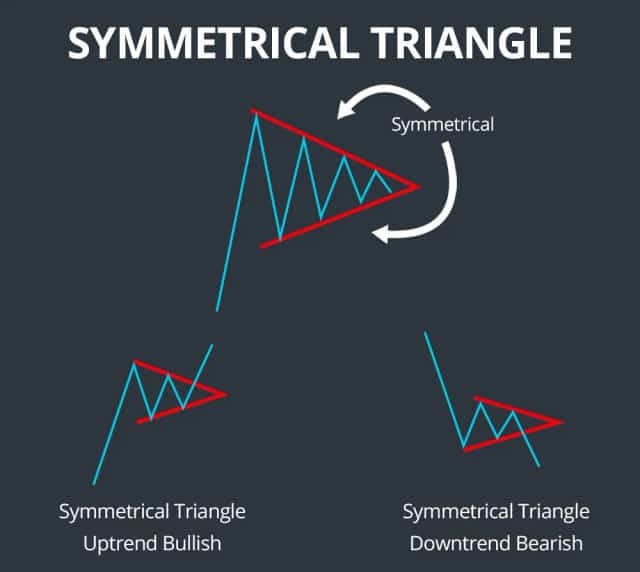
A breakout in either direction signals the next big move. Traders buy if the price breaks above the triangle. They sell if it breaks below. Stop losses are placed on the opposite side of the breakout. This pattern is useful in trending markets.
Double Bottom
The double bottom signals a reversal from a downtrend to an uptrend. We form it when the price reaches the same low twice, creating a “W” shape.
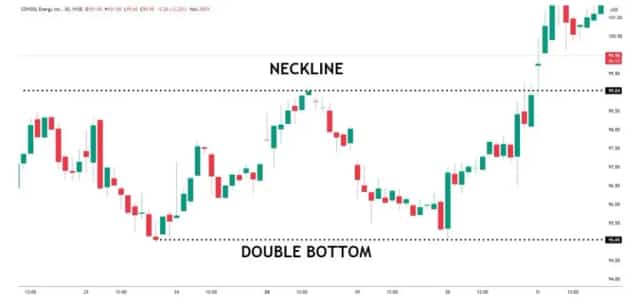
Traders buy when the price breaks above the resistance level between the two bottoms. A stop loss is placed below the second bottom. This pattern is reliable and often leads to strong upward moves.
Head and Shoulders
The head and shoulders pattern signals a trend reversal. We form it when the price creates three peaks: a higher peak (head) between two lower peaks (shoulders).
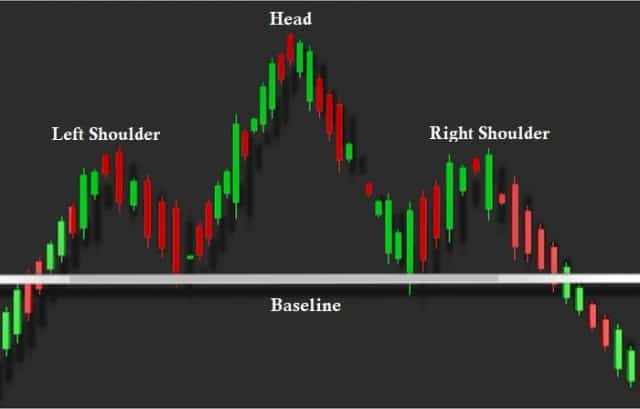
Traders sell when the price breaks below the neckline, which connects the two shoulders. A stop loss is placed above the right shoulder. This pattern is one of the most reliable for spotting trend reversals.
Final Thoughts
Trading chart patterns help investors find good trades. The 10 patterns above work well in 2025’s markets. The traders spot trends, reversals, and breakouts. Always combine chart patterns with other indicators and AI tools for better results.
Frequently Asked Questions (FAQs)
The head and shoulders pattern is the most reliable. It signals trend reversals and works well in both stocks and forex.
The cup and handle pattern has high accuracy. It signals strong bullish moves and often leads to big price increases.
The 1/2/3 pattern marks trend reversals. It has three steps: trend change, pullback, and breakout. Traders use it often.
The bull flag pattern works best for day trading. It signals strong uptrends and helps traders enter trades with confidence.
Disclaimer
Remember, this analysis is for informational purposes only and should not be considered financial advice. Always conduct your own research or consult a financial advisor before making any investment decisions.
What brings you to Meyka?
Pick what interests you most and we will get you started.
I'm here to read news
Find more articles like this one
I'm here to research stocks
Ask Meyka Analyst about any stock
I'm here to track my Portfolio
Get daily updates and alerts (coming March 2026)